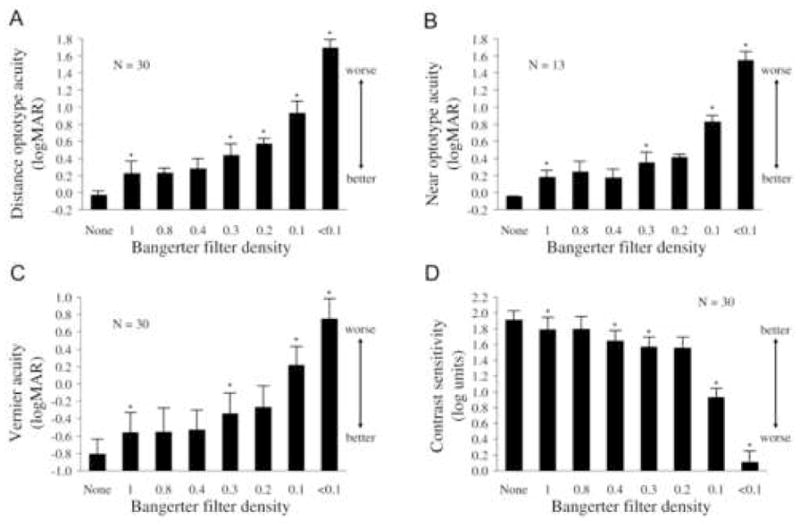
Figure 1.

Visual function at each Bangerter filter strength. A) Distance optotype acuity; B) Near optotype acuity; C) Vernier acuity; D) Contrast sensitivity. Bars represent standard deviations and asterisks indicate where the visual acuity at that Bangerter strength was significantly (P<0.05) worse than at the previous Bangerter strength. All filters caused significant worsening for all modalities of visual acuity in comparison with wearing no filter.
