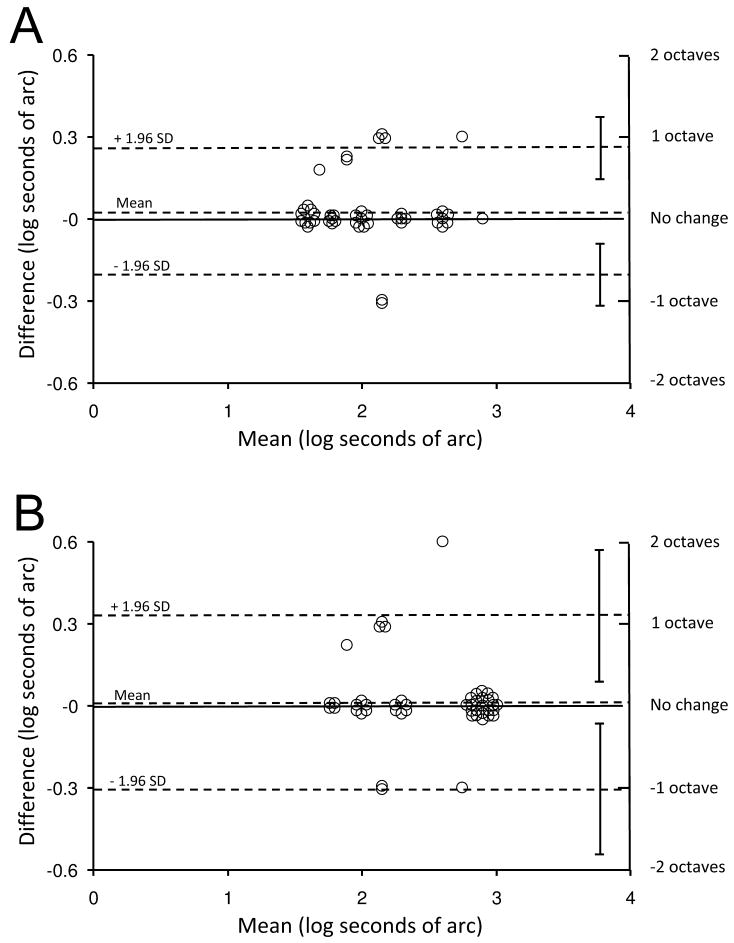
Figure 2.
Test-retest variability for controls represented as Bland-Altman plots. (A) Preschool Randot test (half width of the 95% limits of agreement [LOA] = 0.23 log arcsec; 95% confidence interval [CI]: 0.12 to 0.35) (B). Distance Randot test (half width of the 95% LOA = 0.32 log arcsec; 95% CI: 0.08 to 0.56). Upper and lower dotted lines show 95% limits of agreement. SD = standard deviation.

