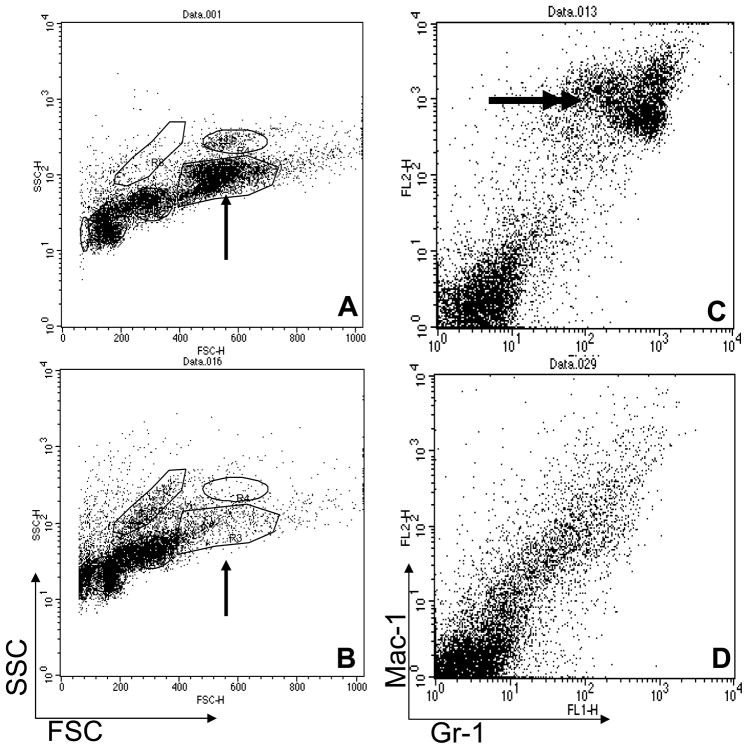
Figure 4. FACS analysis of recipient bone marrows from Hsal2 −/− and WT donors.
Forward and side scatter (FSC&SSC) shows that a recipient of WT donor (A) had a much larger myeloid population (single arrow) than a recipient of a Hsal2 −/− donor (B). Panels C&D show Gr-1 vs Mac-1 expression for cells gated on the indicated (single arrow) myeloid population in panels A&B, respectively. This myeloid population co-expressed Gr-1 and Mac-1 (double arrows) in the recipient of WT donor (C), which was lacking in the recipient of Hsal2−/− donor (D).

