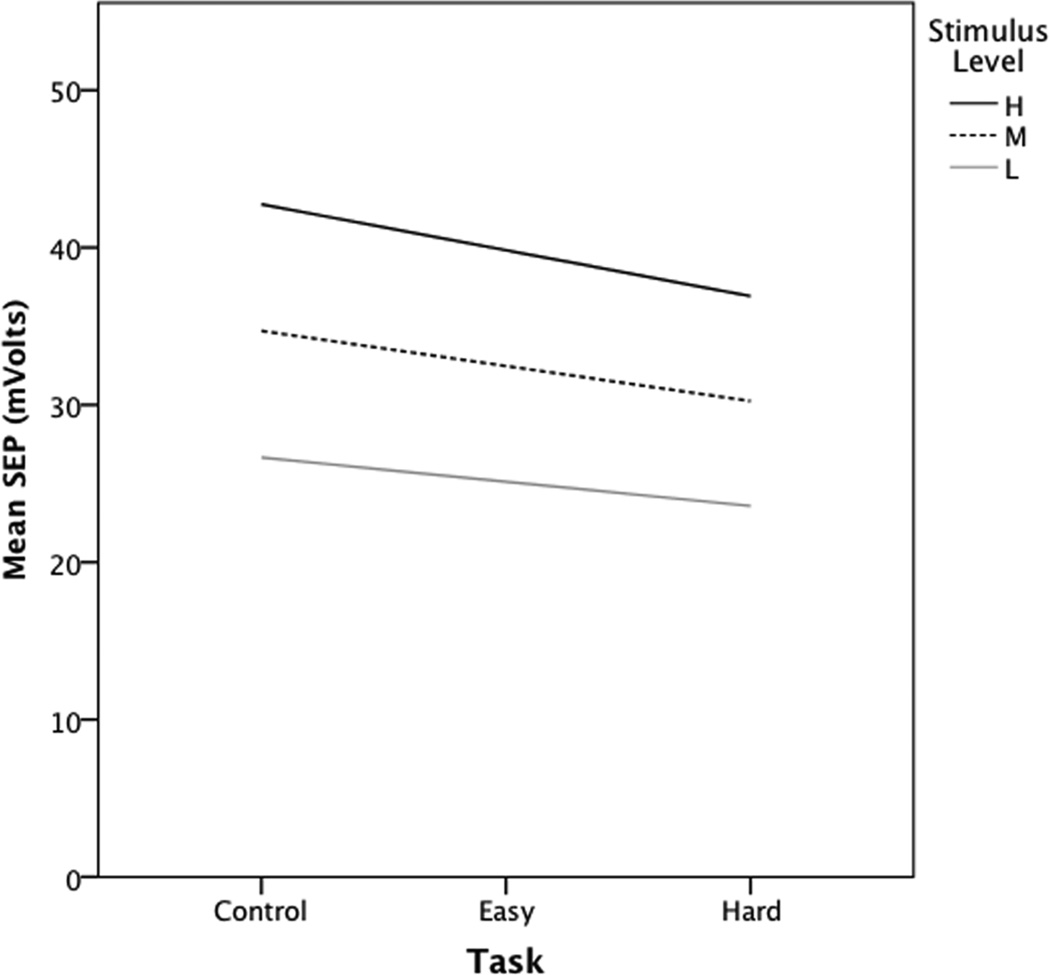
Fig. 4.
Change in stimulus evoked potential responses by task condition and stimulus level. Slopes (standard errors) for linear estimates of change in SEP for unit increases in task demand at each stimulus level: L= −1.54 (0.24), M= −2.23 (0.16), H= −2.92 (0.25). Abbreviations: SEP= stimulus evoked potential; L= low, M= moderate, H= high stimulus level; s.e.= standard error.

