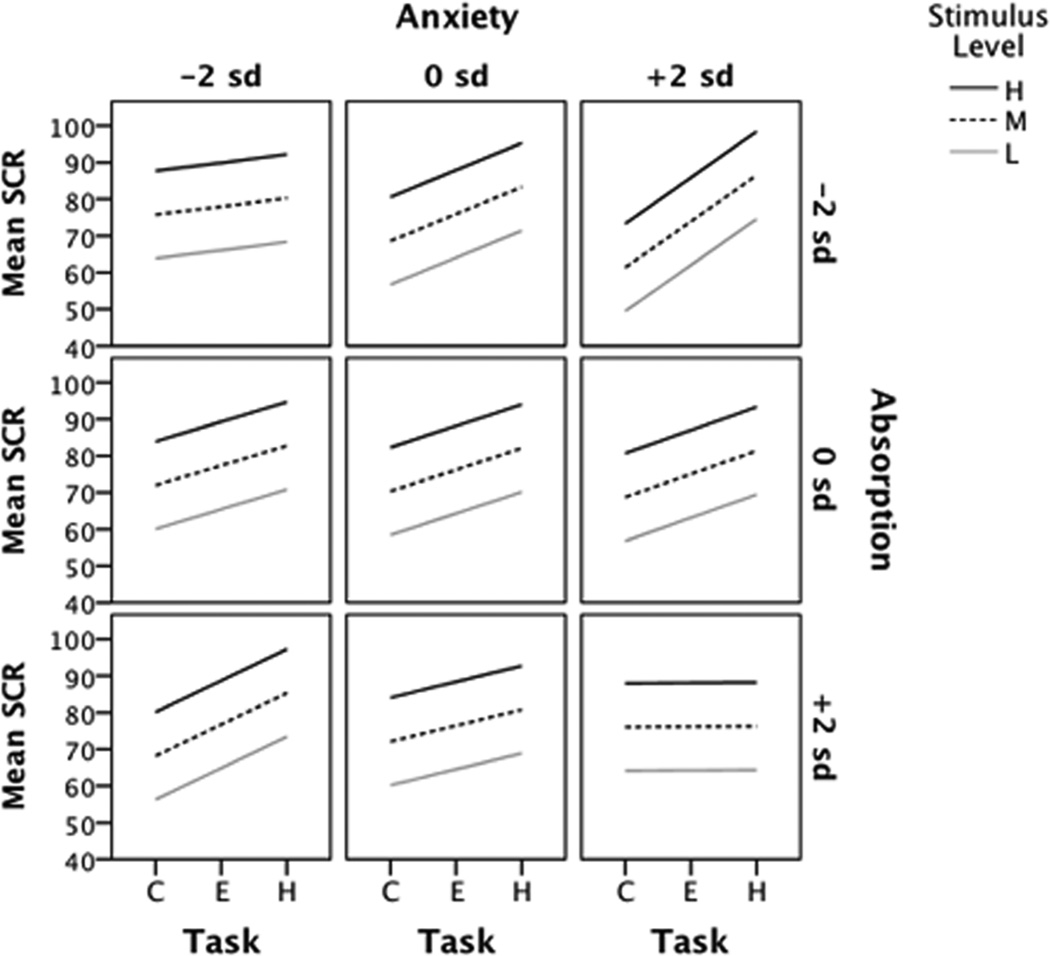
Fig. 6.
Change in skin conductance by task, trait anxiety, and absorption at three stimulus levels. Adjusted mean slopes and intercepts obtained at three values of Anxiety and Absorption: low (−2 s.d.), moderate (0 s.d.) and high (+2 s.d.). Abbreviations: SCR= skin conductance response; L= low, M= moderate, H= high stimulus levels; C= control, E= easy, H= hard task conditions; s.d.= standard deviation.

