
Figure 1.
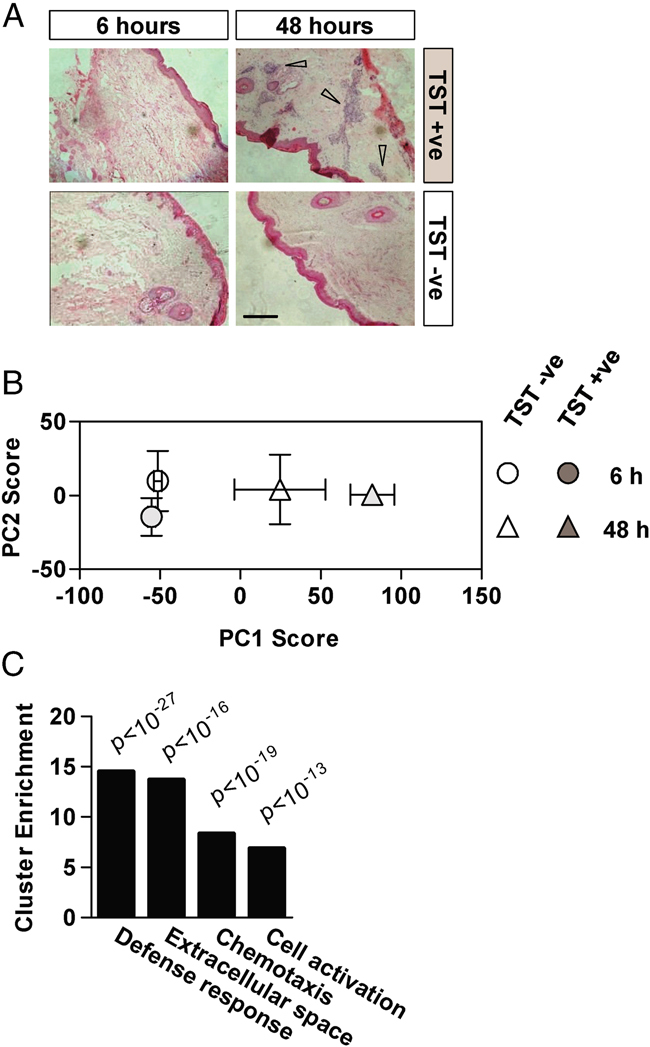
Transcriptional profiling of the TST. TST site skin biopsies from all 20 participants (40 biopsies) were stained with haematoxylin and eosin for histological analysis. (A) Representative histology from 6- and 48-h TST samples is shown. Arrows indicate areas of prominent intradermal inflammatory infiltrate in a localized perivascular distribution. No inflammatory infiltrate was seen in 6-h biopsy samples or in the 48-h samples from TST− subjects (scale bar=400 μM). (B) Principle component analysis (PCA) of microarray data from TST+ and TST− individuals (data points represent mean±SEM of PC scores from four separate subjects in each group). (C) Functional annotation clustering of the 250 genes which displayed the largest expression changes within PC1 was performed to show significantly enriched gene ontology groups (Modified Fisher's Exact Test).