
Figure 6.
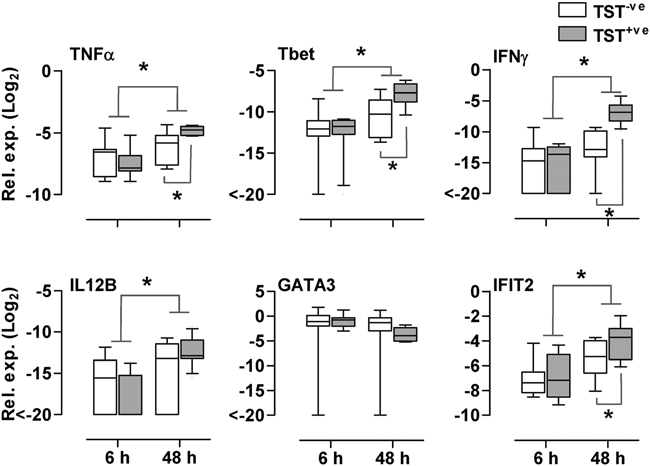
Validation of microarray data by qPCR. Quantitative PCR of selected genes representative of innate immune responses (TNF-α and IL12B), Th1 responses (IFN-γ and Tbet), Th2 responses (GATA3) and IFN-γ-stimulated responses (IFIT2) are shown. Relative gene expression levels are represented in comparison to GAPDH within each sample. Box and whisker plots represent median values, interquartile ranges and 90th percentiles for TST− subjects (N=9) and TST+ subjects (N=11) at each time point. *p<0.05, Mann–Whitney U test.