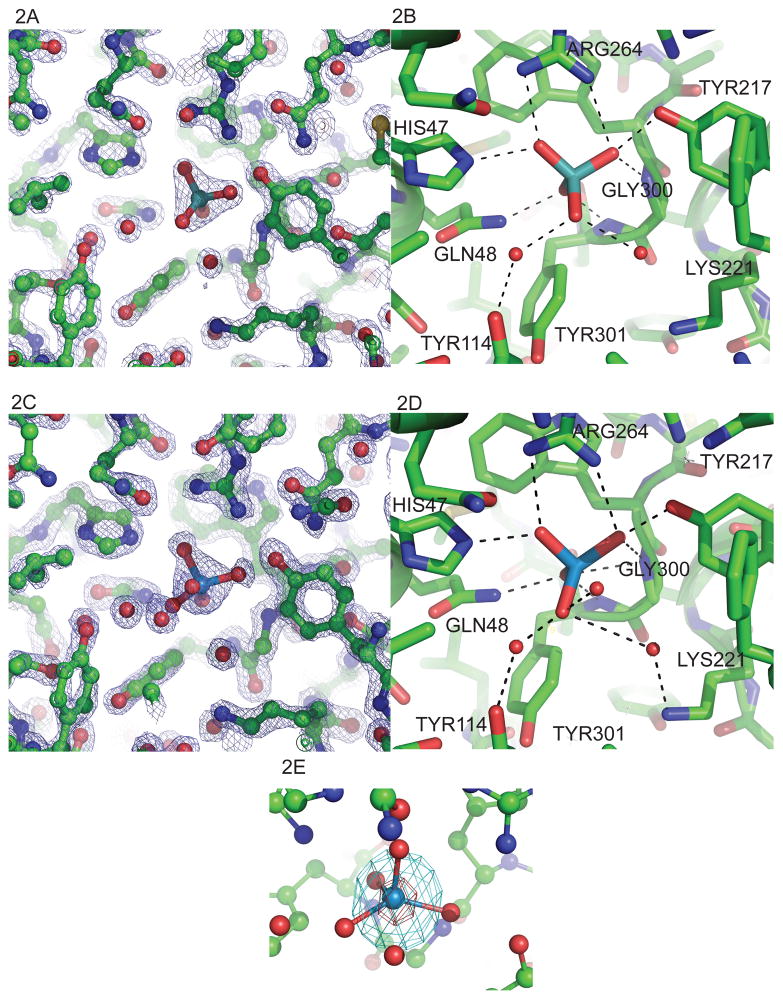
Figure 2.
The ligand binding site of HI1472 with substrate bound. (A) The binding pocket of molA with tungstate (PDB ID 3PSA) and (C) molybdate bound (PDB ID 3PSH). 2Fobs-Fcalc electron density is shown for the ligand binding site. (B) Hydrogen bonds between tungstate and (D) molybdate anion and molA. Residues shown in stick representation, bonds shown by dashed lines and water molecules are shown depicted as red spheres. 2Fobs-Fcalc electron density (contoured at 1.5 σ level) is shown for the tungstate and molybdate ligand binding site in figure 2A and 2C, respectively (also see Figure S5). (E) Anomolous difference map of the tungstate bound structure contoured at 5σ (cyan) and 60σ (red). The graphics were made with PyMOL (W. L. DeLano, DeLano Scientific, San Carlos, CA) .

