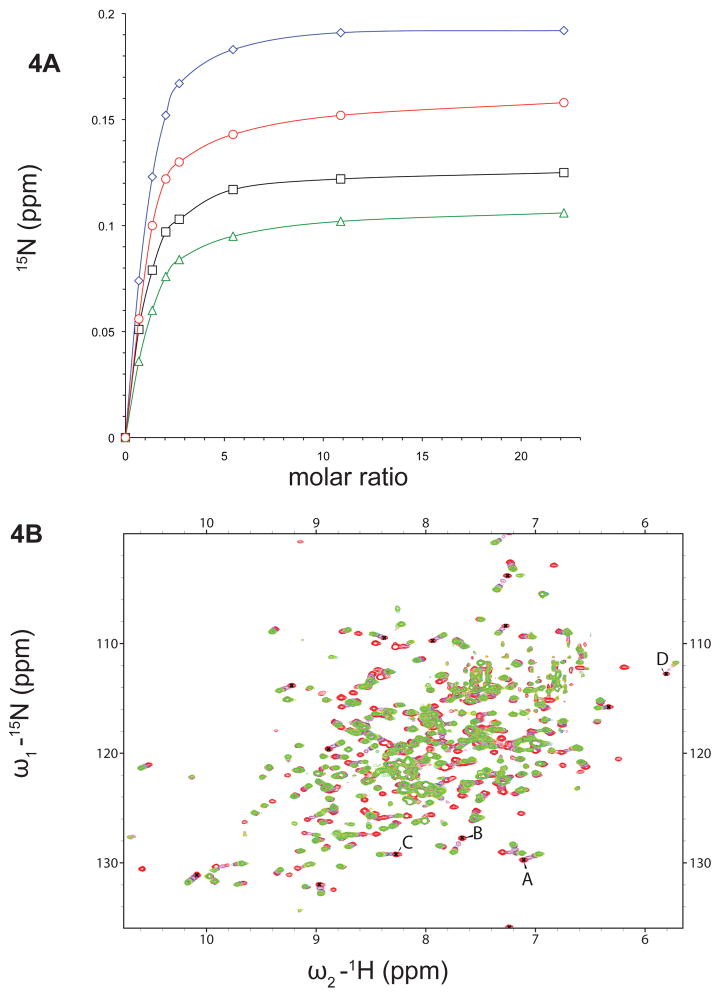
Figure 4.
NMR Binding studies of MolA. A. Titration curves of HI1472 (280.8 mM) with Na2MoO2− 4 at variable ratios (from 1:0.7 to 1:22, HI1472:Na2 MoO2−4). B. Overlay of Transverse Relaxation Optimized Spectroscopy (TROSY) spectra of 15N labeled HI1472 before (red) and after (green) addition of 6.12 mM Na2MoO2−4 (ratio of 1:22 protein:substrate). Peaks chosen for the titration curve are labeled as A, B, C and D respectively.

