Figure 6.
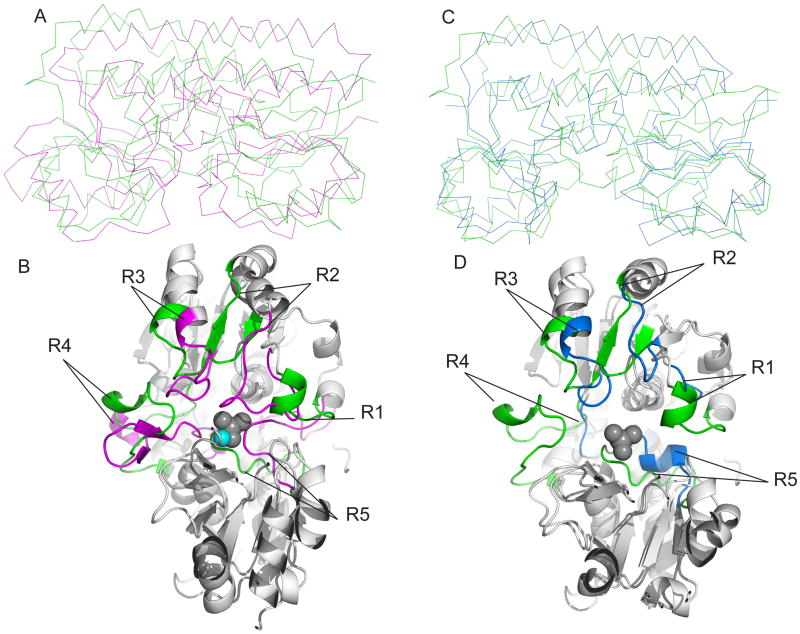
Structural alignment of class III PBPs. The structures of MolA, TroA and BtuF were superimposed by a secondary structure matching method, using PDB3Fold. (A) Superimposed ribbon diagrams of molybdate bound-MolA (green) and Zn (II)-bound TroA. (B) The view from the binding pocket of superimposed cartoon diagram of MolA and TroA. Loops that play a role in the conformation of the binding pocket for molybdate bound-MolA and Zn (II)-bound TroA are colored green and magenta, respectively. The loops that make up the binding site of Zn (II)-bound TroA are labeled R2 (residues 60–77), R3 (residues 88–98), R4 (residues119–137) and R5 (residues 273–291). The loops that make up the binding site of molybdate bound-MolA are labeled R1 (residues 69–77), R2 (residues 91–98), R3 (residues 112–119), R4 (resides 134–153) and R5 (292–304) (also see Figure S4).
(C) Superimposed ribbon diagrams of molybdate bound-MolA (green) and Vitamin B12 bound-BtuF (blue) (D) The view from the binding pocket of superimposed cartoon diagram of molybdate bound-MolA and Vitamin B12 bound-BtuF. Loops that play a role in the conformation of the binding pocket for molybdate bound-MolA and Vitamin B12 bound-BtuF are colored green and blue, respectively. The loops that make up the binding site of Vitamin B12 bound-BtuF are labeled R1 (residues 49–52), R2 (residues 64–71), R3 (residues 85–98), R4 (residues 107–110) and R5 (residues 239–249). The grey spheres represent molybdate bound in the active site of MolA, the cyan sphere represents zinc bound to TroA (vitamin B12 was omitted for clarity of the active site of BtuF). The graphics were made with PyMOL (W. L. DeLano, DeLano Scientific, San Carlos, CA) (also see Figure S4).

