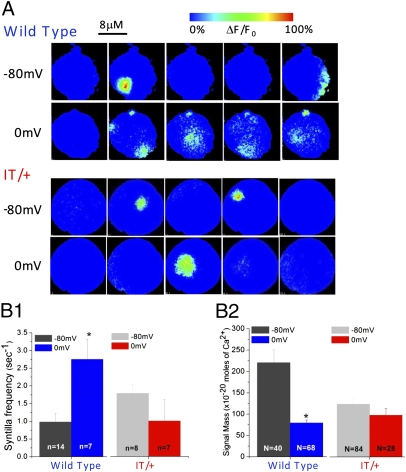
Fig. 2.
VICaR is blocked in the IT/+ mutant. (A) Representative images of Ca2+ syntillas during 4-s recordings at −80 mV and 0 mV in the absence of extracellular Ca2+ and using fluo-3 as a Ca2+ indicator. In WT, depolarization to 0 mV increases the number of syntillas from two at −80 mV (first row) to six at 0mV (second row), but in IT/+ terminals the number of syntillas is not increased: two syntillas at −80 mV (third row) vs. one at 0 mV (fourth row). Syntilla frequency (B1) and Ca2+ signal mass (B2) in WT and IT/+ terminals at −80 mV and 0 mV. VICaR is apparent in the WT (B1, Left), where syntilla frequency is increased from 0.98 ± 0.24 s−1 (n = 14) at −80 mV to 2.75 ± 0.56 s−1 at 0 mV (n = 7), P = 0.003. VICaR is absent in IT/+ (B1, Right). Depolarization to 0 mV decreases the signal mass in WT (B2, Left), the signal mass was decreased from 220.6 ± 30.1 ×10⁻²⁰ moles of Ca2+ (N = 40) at −80 mV to 79.3 ± 6.6 × 10⁻²⁰ moles of Ca2+ (N = 68). In IT/+ (B2, Right), the signal mass was comparable at both voltage settings. *P < 0.05.

