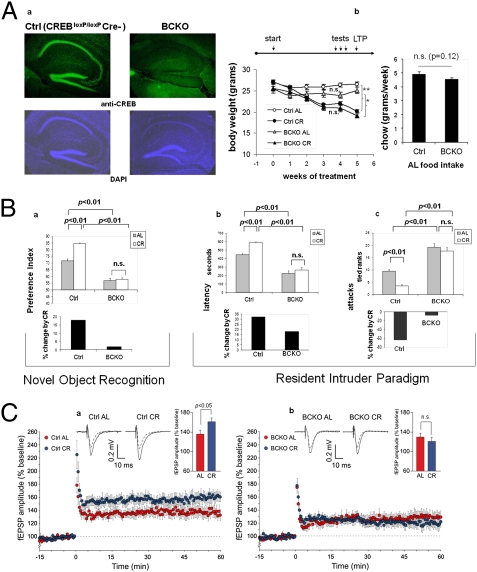
Fig. 1.
Impaired brain response to calorie restriction in mice lacking neuronal CREB. (Aa) Immunofluorescence analysis reveals a near complete deletion of CREB1 in the cortex and hippocampus of 6-mo-old BCKO mice. Nuclear staining with DAPI confirms normal cellularity in the same areas. (b) Weight loss under calorie restriction (Left) and food consumption ad libitum (Right) in control (Ctrl) and BCKO mice (n = 5–6 per group, one of two independent experiments); (Left) **P < 0.01; *P < 0.05; n.s. nonsignificant by two-way ANOVA (4 wk time-point); (Right) P by two-tailed t test. (B) Cognitive and behavioral effects of CR. (a) (Upper) Preference toward the novel object in a novel object recognition paradigm. Values (seconds) are mean ± SEM. (Lower) Percent change by CR. (b and c) (Upper) Latency of the first attack (Left, values in seconds, mean ± SEM) and number of attacks in 10 min (Right, rank in an ordinal scale ± SEM) were scored in a resident-intruder paradigm. (Lower) Percentage changes of the corresponding parameter by calorie restriction in control and BCKO mice datasets (n = 6 animals per group) were analyzed by two-way ANOVA; P values are indicated. Experiments were performed twice with similar results. (C) Time course of Schaffer collateral-CA1 LTP induced by tetanic stimulation in control (a) and BCKO (b) mice. Values are percentages of baseline fEPSP amplitude (100%). (Insets) Representative fEPSPs at baseline (dashed line) and during the last 10 min of LTP recording (solid line). Traces are averages of 10 consecutive responses at the time points selected. Bar graphs compare average LTP magnitudes observed during the last 10 min of recording (percentage of baseline fEPSP amplitude). (Student t test, *P < 0.05).

