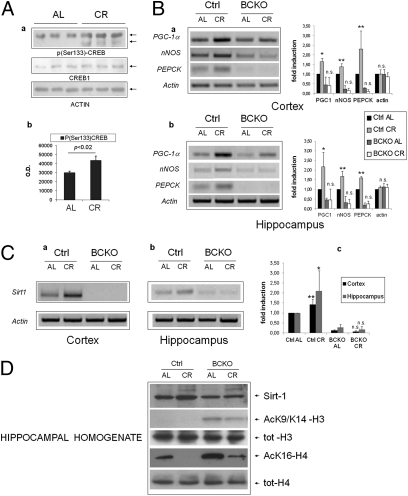
Fig. 2.
Brain CREB is activated by calorie restriction and increases the expression of Sirt-1. (Aa) Western blot analysis of hippocampal homogenates from individual mice revealing increased phosphorylation of CREB on Ser-133 by calorie restriction. (b) Band densitometry normalized to actin; statistics by two-tailed t test. (B) RT-PCR analysis of three canonical CREB target mRNAs in the cortex (a) and hippocampus (b) of control and BCKO mice after 4 wk of AL or CR feeding. Actin was used as loading control. Histograms report fold-induction values compared with Ctrl AL (mean ± SD of three to five mice). *P < 0.05; **P < 0.01; n.s., nonsignificant by two-way ANOVA (CR vs. AL). (C) RT-PCR analysis of Sirt-1 mRNA expression and up-regulation by CR in the cortex (a) and hippocampus (b) of control and BCKO mice. Histogram in c displays fold-induction values relative to Ctrl AL (mean ± SD of three to five mice). Statistics as in B. (D) Western blot analysis of hippocampal homogenates showing impaired up-regulation of Sirt-1 by CR and increased acetylation of histones H3 and H4 at Sirt-1-sensitive sites in BCKO mice. Anti-total H3 and H4 histones confirms equal protein input throughout the lanes. Each lane is the pool of hippocampi from two different mice.

