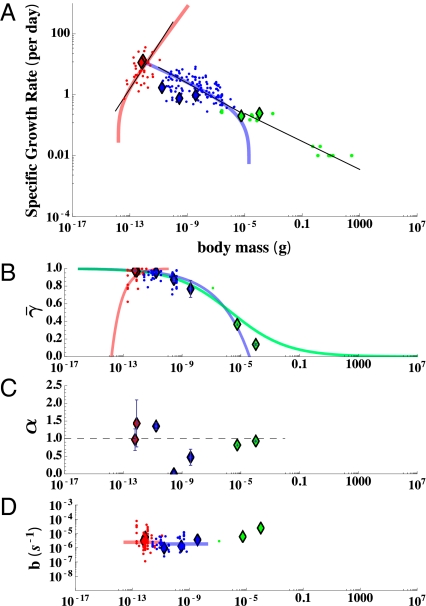
Fig. 3.
(A) Interspecific plot of specific growth rate (day−1) against size along with the metabolic constants (B−D) inferred from fits of our model to individual growth trajectories all plotted against organism mass. The prokaryotes are colored red, the eukaryotes blue, and the small metazoans green. In each panel diamonds represent the results for single individuals, whereas the points are estimates from compiled population studies (ref. 27 for A; our own compilation for C and D). In A the colored curves represent the best fit of the framework to interspecific growth using Eqs. 9 and 10, whereas the black curves are the best fit power law relationships (27). The asymptotes illustrate the size limitations of prokaryotes and unicellular eukaryotes. (B) The average percentage of metabolism devoted to growth,  , illustrates the differences in metabolic partition across the three major taxonomic groups (for prokaryotes there is a dense clustering of points near 1 that is not visible). The colored curves are predictions based on fits from A. (C) The metabolic scaling exponent, α, shows variation at the species and taxonomic levels where the dashed line represents α = 1. (D) The maintenance to biosynthesis cost ratio, b, is on average constant across species and major evolutionary transitions, and the colored curves represent the mean value for each taxon. Error bars represent the SD from the mean of each parameter but do not include the statistical confidence of each nonlinear fit (SI Appendix).

