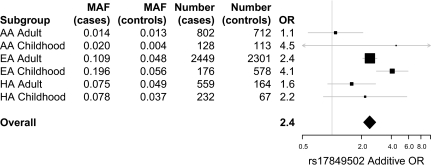
Fig. 2.
Relative contribution of different ethnicities to the overall OR for SNP rs17849502. Forest plot of additive OR ± 95% CI in indicated subgroups and overall OR (Mantel–Haenszel). AsA are not shown because the risk allele of rs17849502 was not found in this population. Size of rectangles is proportional to the weighting of the study in the meta-analysis, the top and bottom of diamond are the overall OR, the left and right whiskers (or left and right diamond edges) are the ±95% CI of the corresponding OR.

