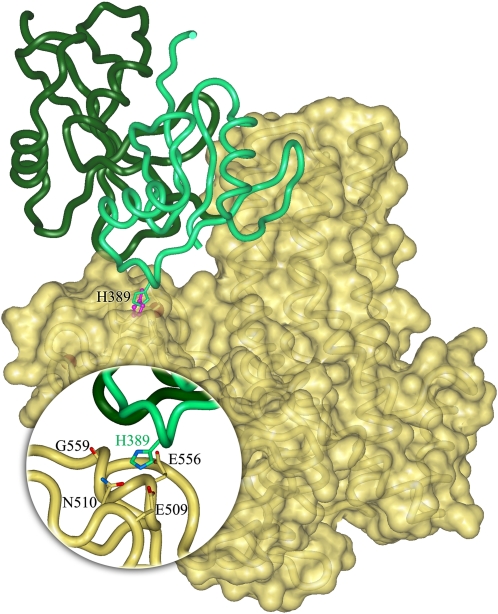
Fig. 5.
Model of the interaction of NCF2 with Vav1 via His389 in the presence of NCF4. Starting coordinates of Vav1 and NCF2 were taken from the PDB. The structure of the NCF2 PB1 domain was extracted from the complex with the PB1 domain of NCF4 [chain A in PDB entry 1oey (16)], and the structure of the DH-PH-ZF domains of Vav1 was taken from the complex with full-length Rac1 [chain B in PDB entry 2vrw (42)]. Coordinates of missing residues in the Vav1 domain DH were completed by superimposing the corresponding domain in the autoinhibited structure of Vav1 [PDB entry 3ky9 (43)]. The solvent-accessible surface of Vav1 is shown in yellow; NCF2 is shown as a ribbon diagram in green with H389 indicated. The nearby His anchoring spot is shown in magenta. NCF4 is shown in dark green. (Inset) Interaction site of H389 detected in the anchoring spots mapping is highlighted. The surface of Vav1 was made transparent to show the side chains of residues that are within 3 Å and interact with H389 in the docking model.

