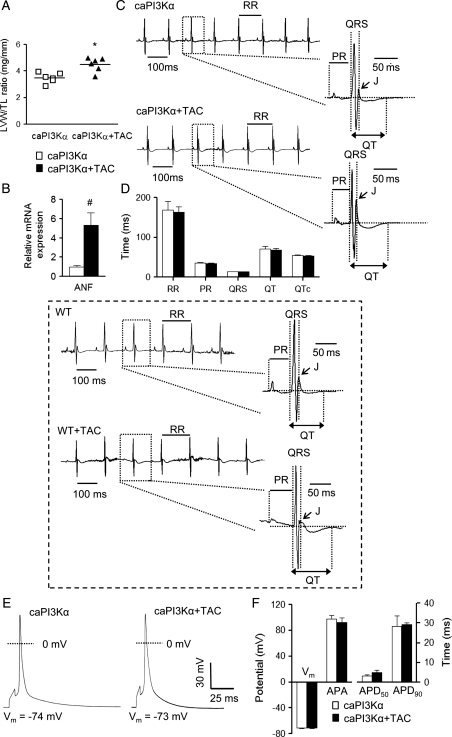
Figure 1.
Increased PI3Kα signalling prevents ECG and action potential waveform abnormalities associated with pressure overload-induced LVH following transverse aortic constriction (TAC). (A) LV mass/tibia length (LVM/TL) ratios were determined in caPI3Kα control (n = 6) and caPI3Kα + TAC (n = 6) animals; individual and mean ± SEM values (*P < 0.001) are plotted. (B) Mean ± SEM (n = 6) relative transcript expression level of atrial natriuretic factor (ANF) is significantly (#P < 0.01) higher in caPI3Kα + TAC than in caPI3Kα control LV. (C) Representative ECG (lead II) waveforms from caPI3Kα mice with and without TAC are illustrated; individual beats are shown on an expanded timescale on the right in each panel. (D) Mean ± SEM RR, PR, QRS, QT, and QTc intervals measured in caPI3Kα + TAC (n = 6) and caPI3Kα control (n = 6) animals were not significantly different. Inset: in contrast to the findings in caPI3Kα animals, and as reported previously,6 TAC in WT animals results in J point suppression and QT prolongation. (E) Action potential waveforms in LV myocytes from caPI3Kα control and caPI3Kα + TAC animals are indistinguishable. (F) No significant differences in mean ± SEM resting membrane potentials (Vm), action potential amplitudes (APA) or action potential durations at 50% (APD50) and 90% (APD90) repolarization were observed in caPI3Kα control (n = 10) and caPI3Kα + TAC (n = 9) LV myocytes.

