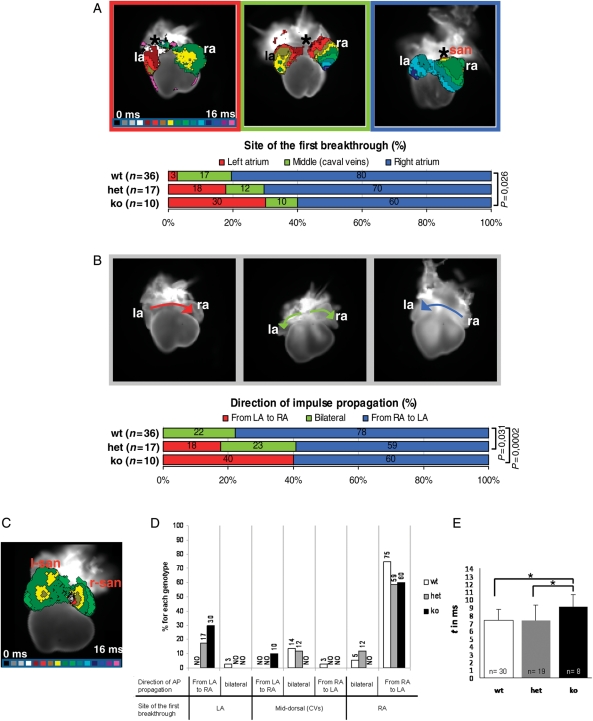
Figure 5.
Pitx2 represses left pacemaker activity within the SV myocardium of E14.5 embryos. (A) Site of first breakthrough. Top: prototypical maps (dorsal view) showing the three main atrial activation patterns recorded in isolated E14.5 hearts by optical mapping. The earliest activated region is indicated with an asterisk. Isochronal lines, delimiting regions activated within the same time frame, are spaced at 1 ms intervals; colour progression visualizes the advancing activation wavefront. Below: diagram showing the distribution of the activation patterns in the three genotypes. n = classified samples. (B) Direction of impulse propagation. Top: three representative examples of observed impulse propagation patterns; arrows depict the direction of electrical activation spread. Below: diagram illustrating pattern distribution within the genotypes. P-values <0.05 are indicated. (C) The L-SAN is functional. Activation map of a cTP ko heart showing the almost synchronous activation of the two SANs. (D and E) Atrial conduction properties in E14.5 wt and cTP mutants. (D) Correlation between the site of first atrial breakthrough and direction of impulse propagation. Columns indicate the combined distribution of atrial activation and propagation patterns within genotypes. Data are expressed as percentages; NO, never observed. (E) Atrial activation times. Data are presented as averages ± standard deviations; *P < 0.05.

