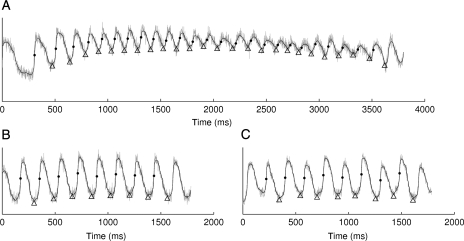
Figure 2.
Optical membrane potential before (grey) and after (black) filtering. Activation and repolarization times (dots and triangles, respectively) were identified by phase values. (A) VF initiation. (B) 180-ms pacing with ||APD alternans|| = 2.3 ms. (C) 180-ms pacing with ||APD alternans|| = 12.0 ms.

