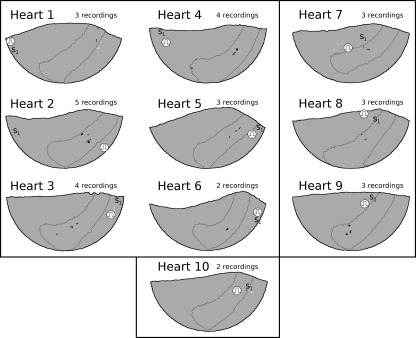
Figure 5.
PST1 sites in all 10 hearts. Sites from all episodes in a heart are displayed on the common epicardial model for that heart (with a Hammer projection). In each model, the ARVI region is outlined. The RV is in the centre of each model, to the left, and above the ARVI, and the LV is on either edge. S1 sites are labelled ‘S1’ and S2 sites are indicated by stimulus symbols. PST1 sites in the ARVI region are black and all others are white. Heart numbers correspond to heart numbers in Table 1. The six hearts with S2 delivery at an LV site are in the upper left panel. The three hearts with RV S2 delivery are in the upper right panel. The one heart with S2 delivery on the ARVI is in the lower panel.

