
Figure 6.
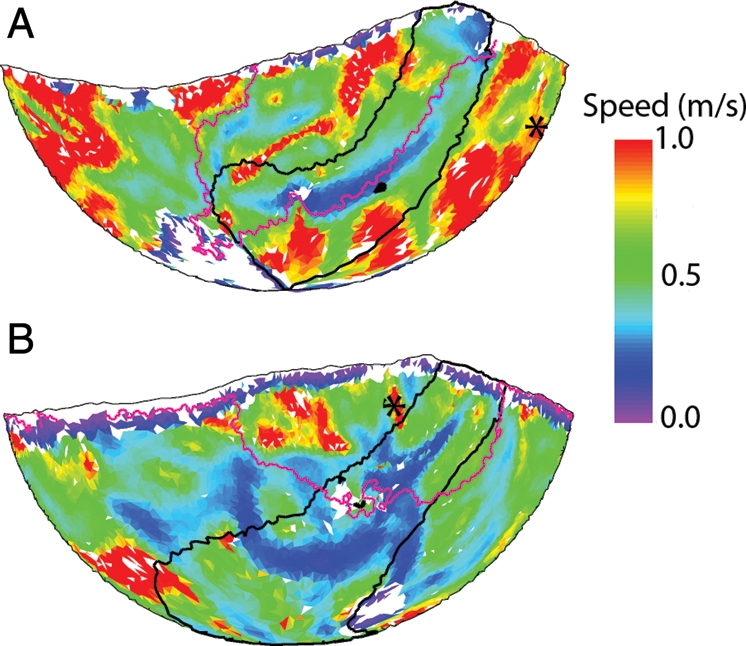
Relation between PST1 sites and conduction speed during the fastest pacing rate with 1:1 capture. A black outline identifies the ARVI region. Black asterisks indicate the pacing site (S1). The magenta line indicates the position of the paced wavefront as it traverses the ARVI near PST1 sites. White triangles indicate missing speed data; black triangles are PST1 sites. (A) Propagation is smooth and parallel to the ARVI. There is a speed trough co-localized with the PST1 sites. (B) Propagation across the ARVI is complex involving the collision between an epicardial wave and a wave breaking through to the epicardium from the septum. PST1s at the ARVI do not correspond to local speed depression in this case.