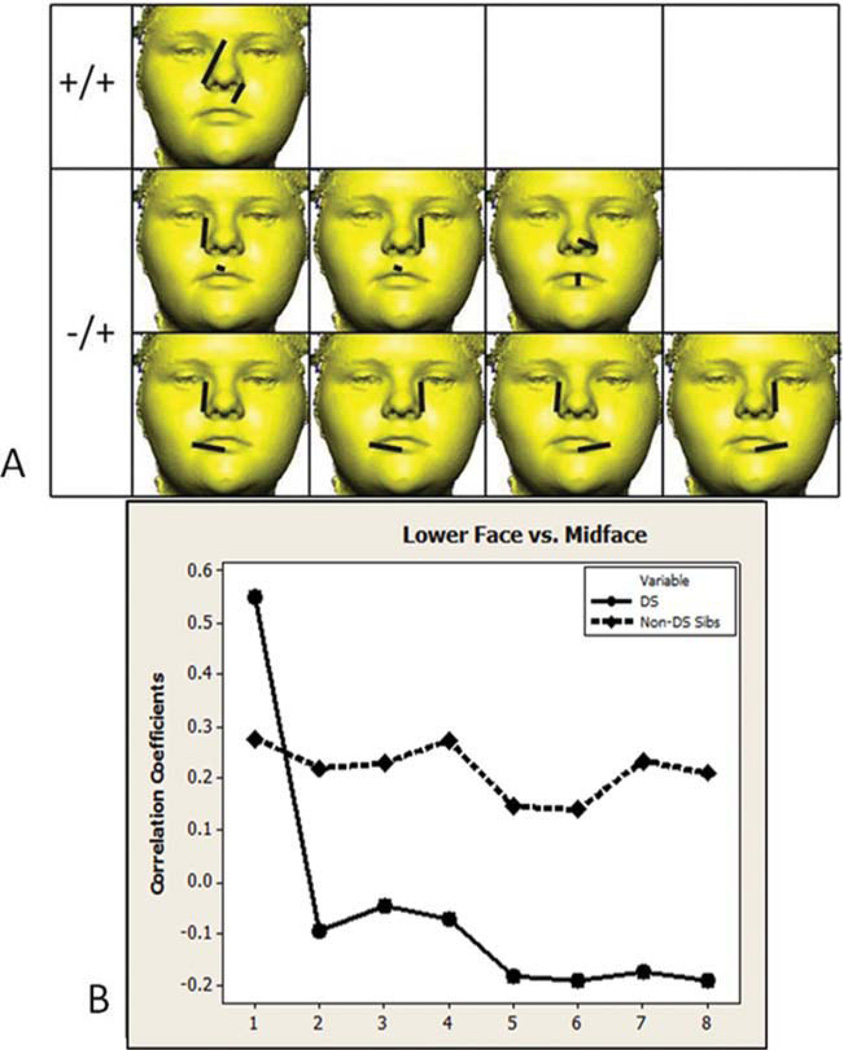
Fig. 5.
Lower face and midface region. A) Eight linear distance pairs that show significantly different associations in the two samples are grouped by the direction of correlation that each sample exhibits (positive +/+, negative in the DS sample, and positive in the non-DS sibling sample −/+). The paired linear distances shown involve measures of lip height and width, and measures of nose height, nasal ala width, and midfacial height. B) Significantly different correlation values are graphed in the same order as distances shown in the picture matrix. Circles and solid lines represent the DS sample. Diamonds and dashed lined represent the non-DS sibling sample. [Color figure can be viewed in the online issue, which is available at wileyonlinelibrary.com.]

