
Figure 2.
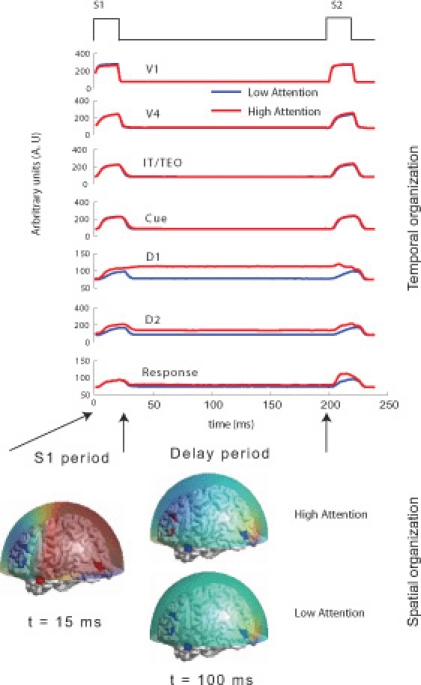
Temporal and spatial organization of simulated neural activity: Total currents in each brain location computed using the large-scale neural model for two different levels of attention (0 and 0.3). During stimulus S1, the sensory and object identification areas are first activated (V1, V4 and IT) followed by activations in prefrontal network (D1, D2, C, and R). For low attention (or zero attention) all units are silent during delay period because no working memory is required to perform the DMS task. D1 and D2 units have sustained activation (recruited) during delay period if high attention is required to store the identity of S1 in working memory while the other units were silent. Neuromagnetic (MEG) activity is simulated at 264 sensors using a forward solution with spherical head model. Topographic maps of this activity are plotted over a transparent hemisphere at times t = 15 (within initial S1) and t = 100 (during delay). During S1 similar identical network organization between passive viewing (low attention) and DMS task performance (high attention) occurs. However, network organization changes during the delay period. Discerning by looking at raw topographic maps is quite hard, as illustrated by closeness of the scalp topography between the two task conditions during delay period. The temporal microstructure of cortical network (TMCN) analysis retrieves the onset of recruitment of the task-specific prefrontal networks at the sensor level.