
Figure 3.
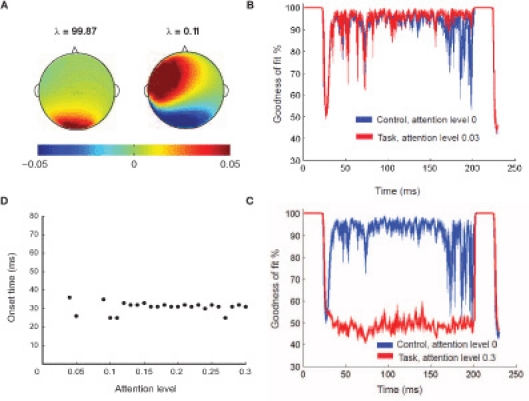
Temporal microstructure analysis. (A) The two principal components (and corresponding eigenvalues λ) computed from the DMS task at lowest attention level that spans the control subspace. The sum of the eigenvalues amounts to the total variance of the control condition that is capture by these two patterns. (B) The mean goodness of fit of reconstruction (Gof) time series plotted as a function of time when the difference in attention levels is low. The error bars at 95% significance level are also plotted as a function of time (patches). In this scenario, lack of significant recruitment results in statistically equivalent Gof over time. (C) The mean goodness Gof time series from two conditions are plotted as a function of time when the difference in attention levels is high. The error bars at 95% significance level are also plotted as a function of time (patches). The regime of difference in Gof distributions reflect the time scale of recruitment. (D) Sensitivity analysis for onset time detection: Onset time plotted as function of different attention levels. For all levels of attention (except the zero attention scenario) the same prefrontal network (D1, D2) is recruited in the delay period, with varying degrees of intensity. At low attention (gain < 0.09), onset time of this prefrontal network recruitment occurs twice by chance. However, after a threshold level of attention (0.09), onset time is consistently detected for all higher levels.