
Figure 2.
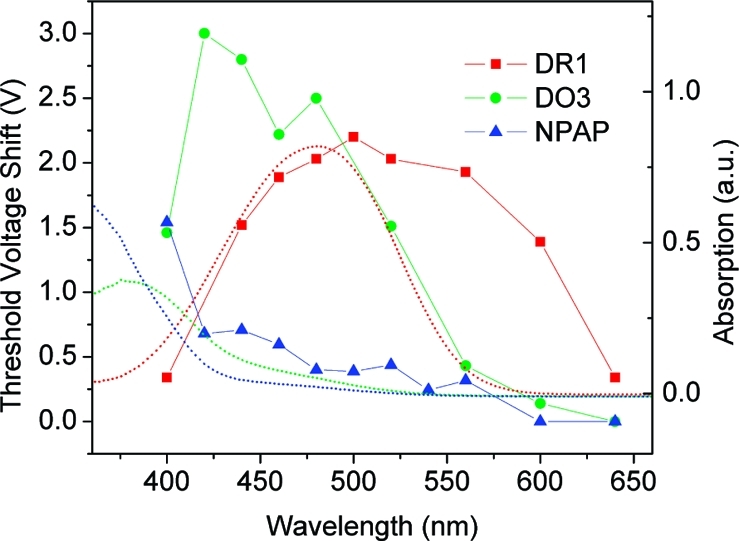
The threshold voltage shift of devices functionalized with different chromophores (DR1, red squares; DO3, green dots; and NPAP, blue triangles) correlates with the absorption spectra (dotted curves) of these molecules.
Official websites use .gov
A
.gov website belongs to an official
government organization in the United States.
Secure .gov websites use HTTPS
A lock (
) or https:// means you've safely
connected to the .gov website. Share sensitive
information only on official, secure websites.
The threshold voltage shift of devices functionalized with different chromophores (DR1, red squares; DO3, green dots; and NPAP, blue triangles) correlates with the absorption spectra (dotted curves) of these molecules.