Figure 5.
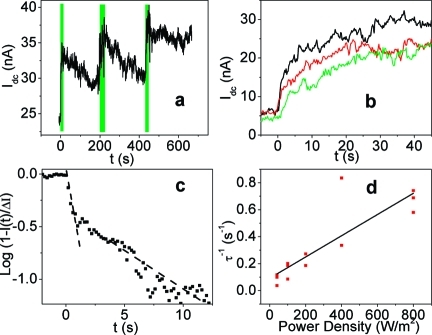
Temporal response of chromophore-functionalized devices upon illumination. (a) The conduction of a DR1-PB functionalized device increases rapidly upon illumination and drops back slowly when the illumination is turned off. (b) The conduction rise of the same device for different intensities: 200 (black), 100 (red), and 40 (green) W/m2. (c) When the change in conduction is plotted logarithmically against time, two time scales can be seen. The fast one (τ ∼ 2 s) dominates for the first few seconds after illumination is turned on, but the change slows down afterward. (d) The inverse of the fast time scale τ is directly proportional to the power density. τ of the same device is measured three times at each power density and all three values are shown in the plot.

