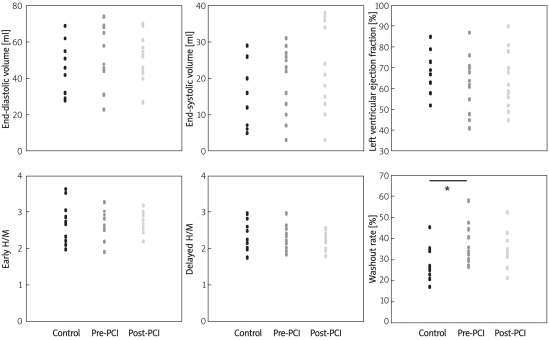
Figure 1.
Quantitative gated single photon emission computed tomography findings. Top: Parameters in controls, before and after PCI*. There were no significant differences in LVEDV (44.6 ±14.5 ml, 51.4 ±12.3 ml and 53.0 ±16.0 ml, respectively), LVESV (14.3 ±8.6 ml, 19.3 ±9.2 ml and 21.5 ±12.1 ml, respectively) or LVEF (70.4 ±10.5%, 64.0 ±13.7%, 62.3 ±13.4%, respectively). Bottom: Planar image shows no significant differences in early or delayed H/M ratios between patients with AP before PCI and controls (early 2.70 ±0.36 vs. 2.73 ±0.57; delayed 2.26 ±0.33 vs. 2.40 ±0.43, all p > 0.2). Early and delayed H/M ratios after PCI remained unchanged compared with those before PCI (early 2.72 ±0.27; delayed 2.23 ±0.22, all p > 0.2). Global WR before PCI was significantly higher in patients than in controls (36.7 ±9.3% vs. 28.1 ±8.2%, p = 0.025). However, WR after PCI did not significantly differ between the AP patients and the controls (34.3 ±7.8% vs. 28.1 ±8.2%, p = 0.10)
*All abbreviations are explained in the text of the manuscript

