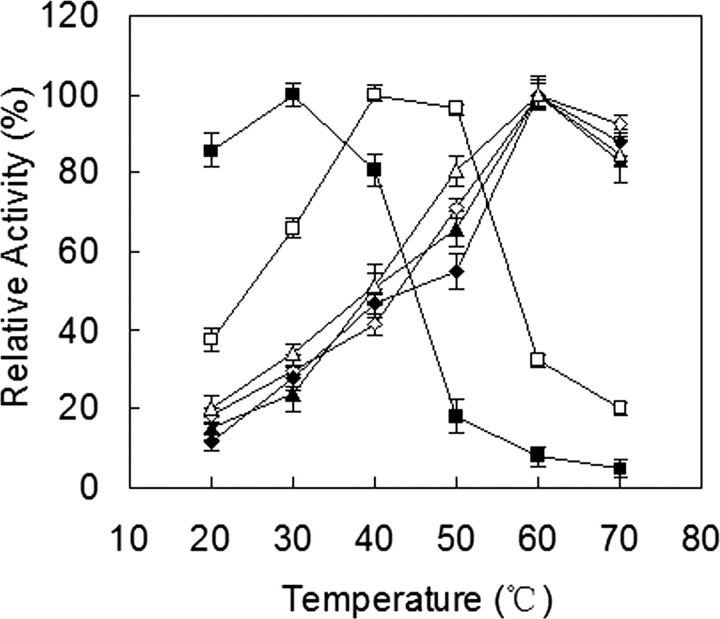
FIGURE 2.
Temperature optimum of cutinase. ▵ and ▴, Tfu_0882 using pNPB and triolein as substrates, respectively; ⋄ and ♦, Tfu_0883 using pNPB and triolein as substrates, respectively; □ and ▪, F. solani pisi cutinase using pNPB and triolein as substrates, respectively. Error bars correspond to the standard deviation of three determinations.

