
FIGURE 4.
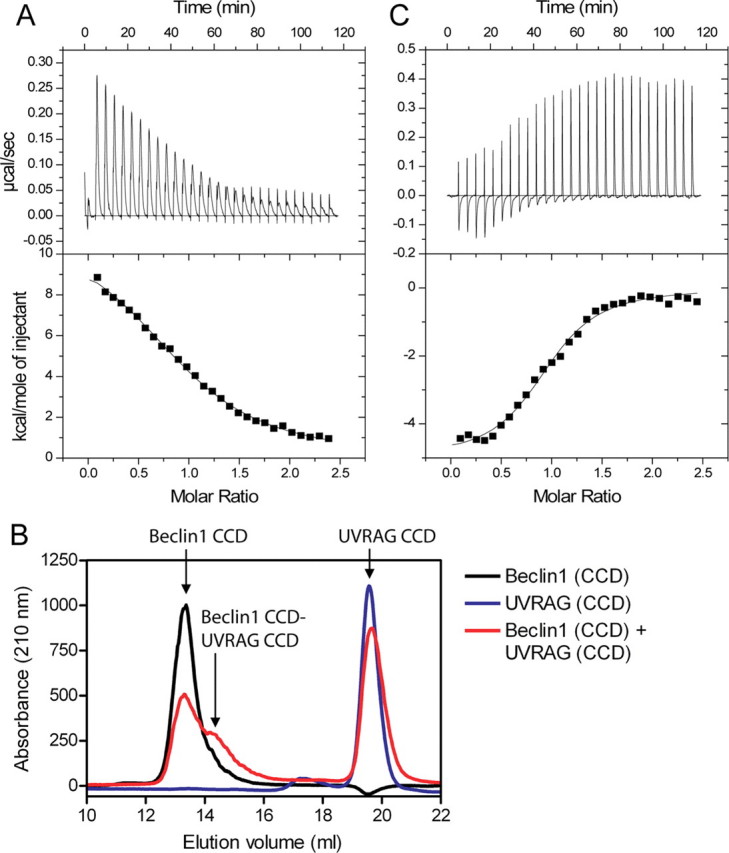
UVRAG disrupts the Beclin1 dimer interface. A, ITC titration for UVRAG CCD in the injection syringe and Beclin1 BH3-CCD in the cell. B, analytical gel-filtration profiles, measured at 210 nm for Beclin1 CCD, UVRAG CCD, or a mixture of the two. C, ITC titration for vBcl-2 in the injection syringe and Beclin1 BH3-CCD in the cell in the presence of a 2-fold excess of UVRAG CCD. The ITC data were fitted to a single-site model.