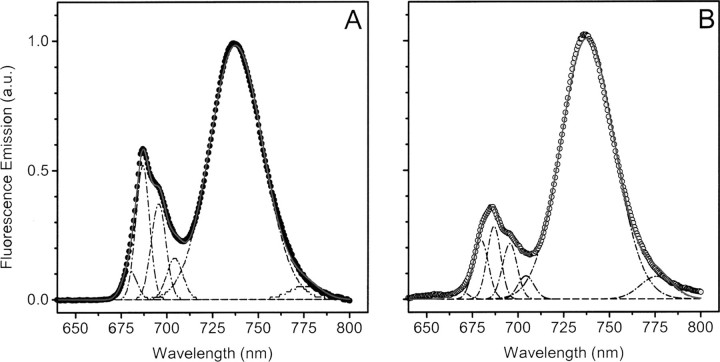
FIGURE 3.
77 K fluorescence emission spectra in mesophyll (A) and bundle sheath (B) thylakoids. Thylakoid protein samples (50 μg of Chl) were loaded into a metal cuvette, which was directly immersed in liquid nitrogen. Fluorescence spectra were recorded upon excitation at 470 nm. Emission spectra were deconvoluted with a sum of 5 Gaussian functions (dotted lines), and the relative fraction of weakly coupled LHCII was estimated from the ratio between the 680 nm band and the sum of all of the PSII related bands. Peaks were normalized to aid their comparison. a.u., absorbance units.

