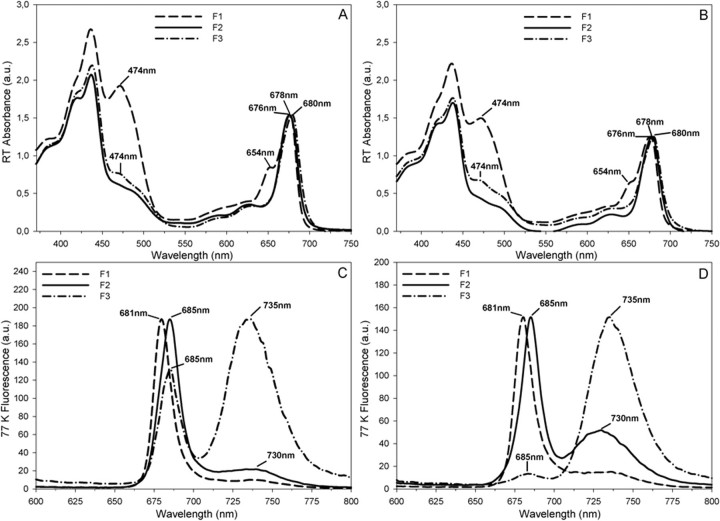
FIGURE 5.
Optical absorbance and fluorescence properties of sucrose gradient fractions obtained from MS (A and C) and BS (B and D) thylakoids. Spectra corresponding to F1 (LHCs), F2 (PSI/PSII), and F3 (LHCI·PSI) fractions are presented as dashed, solid, and dotted-dashed lines, respectively. A and B, room temperature (RT) absorbance spectra. C and D, fluorescence spectra were recorded at 77 K using excitation at 435 nm. Peaks have been normalized to aid their comparison. a.u., absorbance units.

