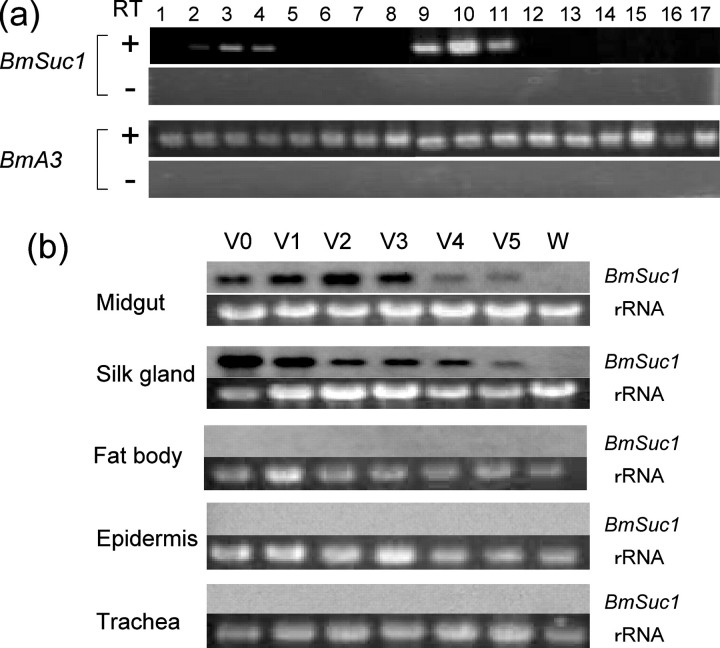
FIGURE 5.
Expression profiles of BmSuc1 mRNA. a, RT-PCR analysis of BmSuc1 expression. Total RNA from the 3rd day of the fifth instar larvae were used in the RT-PCR analysis. The B. mori actin 3 (BmA3) gene was used as the control. Template cDNAs used for RT-PCR experiments were synthesized with (+) or without (-) reverse transcriptase. Tissues used for analysis were as follows. Lane 1, foregut; lane 2, anterior part of the midgut; lane 3, middle part of the midgut; lane 4, posterior part of the midgut; lane 5, anterior part of the intestine; lane 6, posterior part of the intestine; lane 7, rectum; lane 8, testis; lane 9, anterior silk gland; lane 10, anterior part of the MSG; lane 11, middle part of the MSG; lane 12, posterior part of the MSG; lane 13, posterior silk gland; lane 14, malphigian tubules; lane 15, fat bodies; lane 16, trachea; lane 17, epidermis. b, RNA blot analysis of BmSuc1. Total RNA (5 μg) of the midgut, silk gland, fat bodies, epidermis, and trachea from day 0–5 of fifth instar larvae (V0–V5, respectively) and from larvae at wandering stage (W; day 6) were analyzed. rRNA stained with ethidium bromide was used as a loading control.

