FIGURE 5.
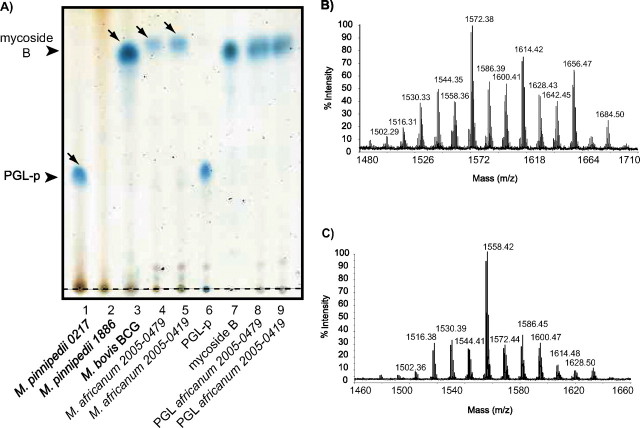
Analysis of the PGL produced by some M. africanum and M. pinnipedii isolates. A, TLC analysis of lipid extracts from M. pinnipedii 0217 (lane 1), M. pinnipedii 1886 (lane 2), M. bovis BCG (lane 3), M. africanum 2005-0479 (lane 4), M. africanum 2005-0419 (lane 5), and of purified compounds from M. pinnipedii 0217 (lane 6), M. bovis BCG (lane 7), M. africanum 2005-0479 (lane 8), and M. africanum 2005-0419 (lane 9). The purified PGL spotted on lanes 6–9 corresponded to compounds indicated by arrows on lanes 1–5. Lipid extracts were dissolved in CHCl3 and were run in CHCl3/CH3OH (95:5, v/v). Glycolipids were visualized by spraying the plates with 0.2% anthrone (w/v) in concentrated H2SO4 followed by heating. Origins of the TLCs are indicated by the dotted line. B, MALDI-TOF mass spectrum for the PGL produced by M. africanum 2005-0479. C, MALDI-TOF mass spectrum for the PGL produced by M. pinnipedii 0217.

