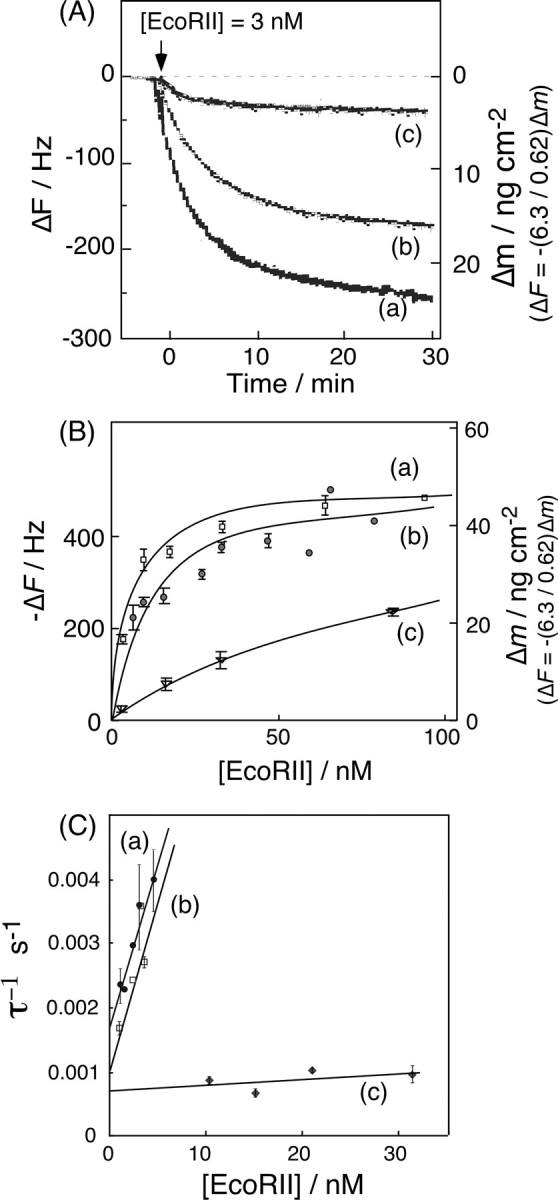
FIGURE 3.

A, typical frequency changes of: (curve a) 2-site DNA, (curve b) 1-site DNA, and (curve c) 0-site DNA immobilized onto a QCM, in response to the addition of EcoRII in the presence of Ca2+ ions. The arrow indicates the time of enzyme injection. ([EcoRII] = 3 nm, [DNA] = 19 ± 1 ng (0.55 ± 0.02 pmol) cm–2 on a QCM, in 5 mm CaCl2, 10 mm Tris-HCl, pH 7.5, 50 mm NaCl, 1 mm DTT, 25 °C). B, saturation binding of EcoRII to each DNA. Each curve was fitted with Equation 1 displayed in the text. C, linear reciprocal plots of the relaxation rate (τ–1) against the EcoRII concentration according to Equations 5 and 6 in the text.
