
FIGURE 8.
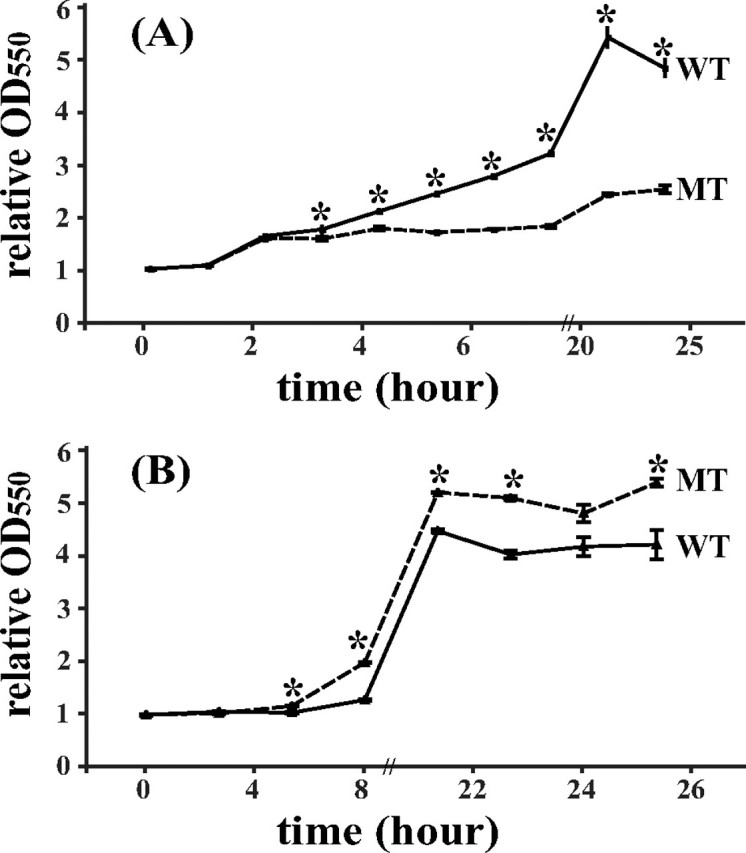
Growth curves of E. coli cells expressing wild-type HspA or C-terminal deletion mutant. E. coli cells were grown in M9 minimal medium supplemented with 5 μm NiSO4 (A) or 500 μm CBS (B). At each selected time point, the ratios of the A550 values at different times versus the value at starter culture (t = 0 h) were used to represent the relative growth rate. The statistical difference between the wild type (WT) and mutant (MT) was estimated by Student's t test, and asterisks indicated that the two sets of data are significantly different from each other. Each datum point was tested independently in triplicate, presented as the mean ± S.D.