
FIGURE 1.
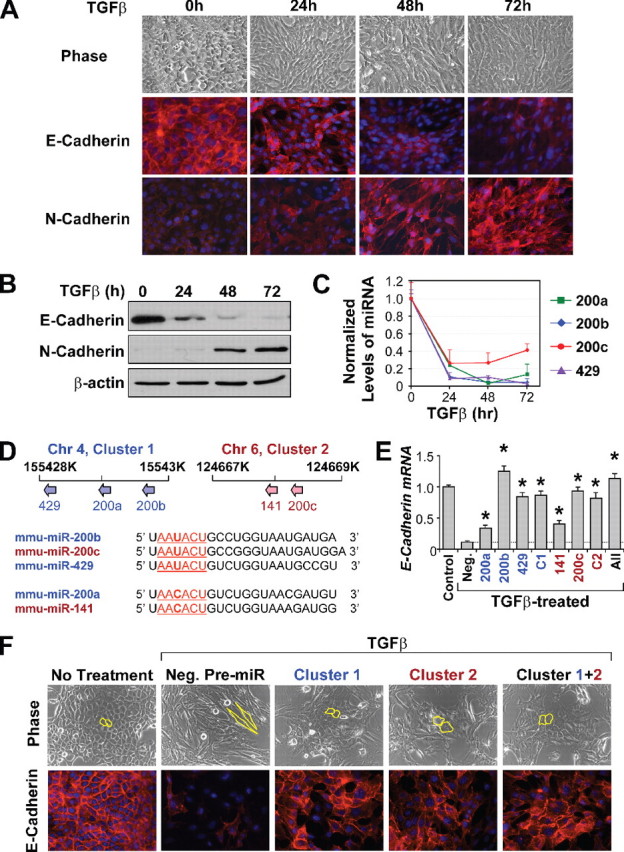
Overexpression of miR-200 family hinders EMT and up-regulates E-cadherin expression. A, phase contrast images and immunofluorescence staining of E-cadherin and N-cadherin in NMuMG cells undergoing EMT. B, Western blot analysis confirms down-regulation of E-cadherin and up-regulation of N-cadherin during EMT. C, changes in the miR-200 family levels in TGFβ-treated NMuMG cells, as measured by TaqMan qRT-PCR and normalized to U6 expression. The data are means from a representative time course experiment measured in triplicate and are presented as mean ± S.E. D, upper panel, schematic of chromosomal locations of the miR-200 family members in the mouse genome. Lower panel, sequence alignment of the miR-200 family members. Nucleotides 2–7, representing their seed sequences, are underlined. miR-200 members embedded within cluster 1 are in blue, whereas those embedded in cluster 2 are in red. Chr 4, chromosome 4. E, changes in expression of E-cadherin in NMuMG cells treated with TGFβ and transfected with miR-200 members individually, as clusters (C1 or C2), or altogether (All), as measured by real-time PCR. Expression levels are compared with cells untreated with TGFβ (control) or TGFβ-treated cells transfected with a negative control pre-miR (Neg.). * represents p < 0.05 as compared with control pre-miR. F, phase contrast microscopy and E-cadherin staining of NMuMG cells untreated or treated with TGFβ after being transfected with negative control pre-miR, cluster 1, cluster 2, or both clusters simultaneously (Cluster 1+2). Cell morphology is outlined in yellow.