
FIGURE 2.
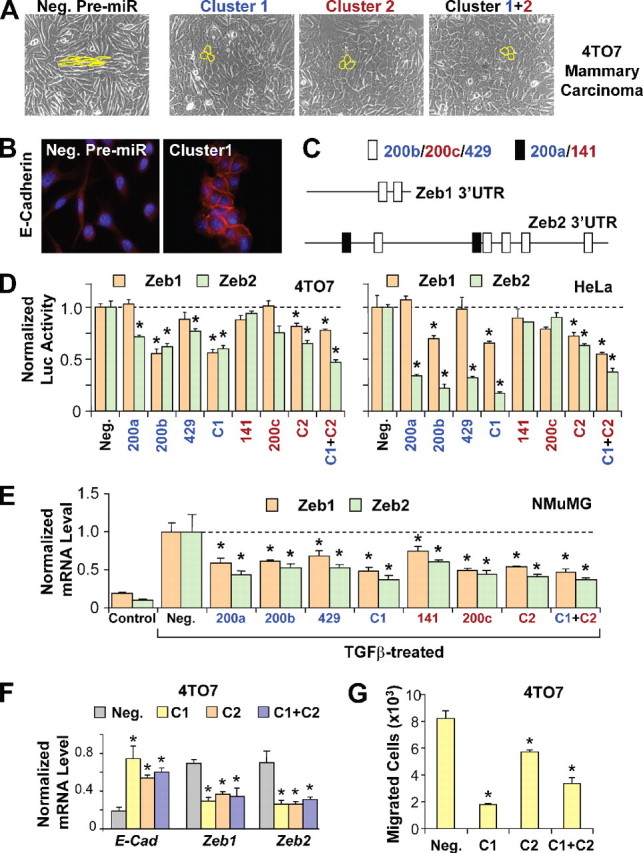
miR-200 family targets transcriptional repressors ZEB1 and ZEB2 to enhance E-cadherin expression and inhibit migration. A, phase contrast microscopy of 4TO7 cells transfected with negative control pre-miR (Neg.), cluster 1, cluster 2, or both clusters simultaneously (Cluster 1+2). Cell morphology is outlined in yellow. B, E-cadherin staining of 4TO7 cells transfected with negative control pre-miR or cluster 1. C, schematic of putative miR-200 target sites in the mouse ZEB1 and ZEB2 3′-UTRs. White boxes represent target sites for miR-200b/200c/429, whereas black boxes represent target sites for miR-200a/141. D, normalized activity of luciferase reporter with the ZEB1 (brown bars) or ZEB2 (green bars)3′-UTR in 4TO7 (left panel) or HeLa cells (right panel) in the presence of co-transfected negative control pre-miR or miR-200 members individually, as clusters (C1 or C2) or both clusters (C1 + C2). Luciferase activity was measured after 24 h. The data are mean ± S.E. of triplicates and are shown as the ratio of firefly to Renilla luciferase activity. E, expression levels of ZEB1 and ZEB2 in NMuMG cells untreated (Control) or treated with TGFβ, transfected with negative control pre-miR or miR-200 family members individually, as clusters (C1 or C2), or both clusters (C1 + C2). F, changes in expression of E-cadherin (E-Cad), ZEB1, and ZEB2 (normalized to GAPDH without further normalization to the negative control) in 4TO7 cells transfected with negative control pre-miR or with cluster 1, cluster 2, or both clusters. G, migration of 4TO7 cells transfected with negative control pre-miR, cluster 1, cluster 2, or both clusters, toward serum containing media. The data are the average number of cells that migrated in a representative experiment measured in triplicate and are presented as means + S.E. * represents p < 0.05.