FIGURE 10.
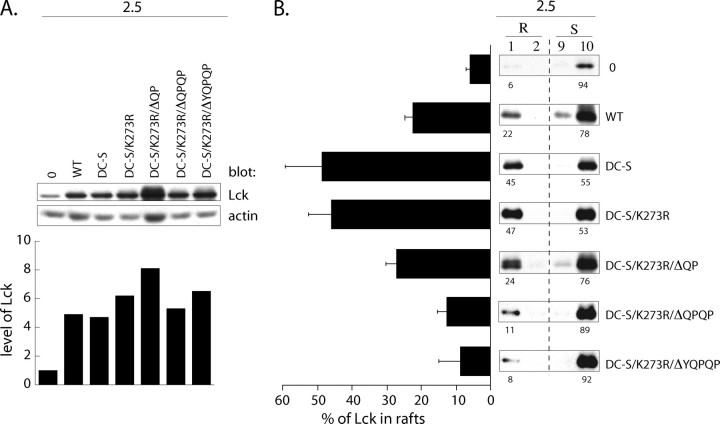
C-terminal “QPQP” sequence targets Lck to lipid rafts in T cell clone 2.5. A, 105 2.5 T cells infected with the empty retroviral Migr1 vector (0), or Migr1 containing either WT Lck (WT), C20S/C23S Lck (DC-S), C20S/C23S+K273R Lck (DC-S/K273R), C20S/C23S+K273R+ΔQP Lck (DC-S/K273R/ΔQP), C20S/C23S+K273R+ΔQPQP Lck (DC-S/K273R/ΔQPQP), or C20S/C23S+K273R+ΔYQPQP Lck (DC-S/K273/ΔYQPQP) were resolved on SDS-PAGE and immunoblotted with anti-Lck. Histogram shows the relative cellular level of Lck in 2.5 infectants normalized to that in the empty Migr1 infectant, which was assigned an arbitrary value of 1. B, 106 2.5 infectants from A were lysed in TKM buffer +0.5% Brij 58 and subjected to sucrose gradient centrifugation. 15 μl of each fraction was subjected to SDS-PAGE and probed with anti-Lck. Numbers below the panels indicate the percentage distribution of Lck in lipid rafts (R) and membrane-soluble (S) fractions. Bar graph to the left represents the mean value of Lck amount (%) partitioning to LR. Values are derived from three independent experiments.

