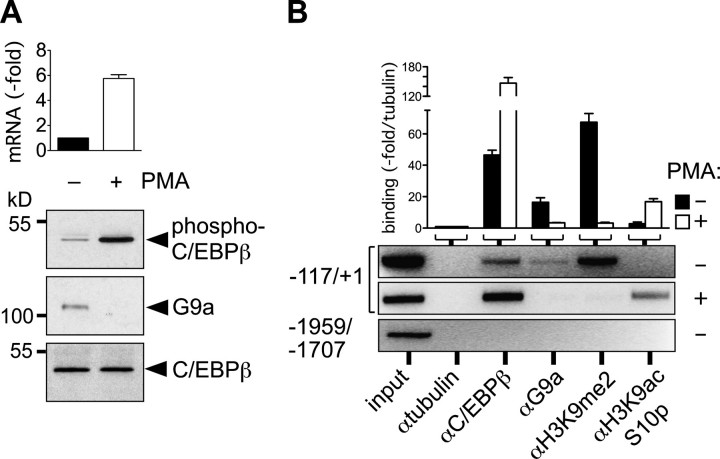
FIGURE 4.
Interaction between C/EBPβ-G9a and hELA2 promoter occupancy. A, myeloid U937 cells were treated with or without PMA (2 h) and lysed, and sequential immunoprecipitation and immunoblotting were performed with anti-phospho-C/EBPβ (IP) and anti-C/EBPβ (H-7, immunoblot, upper panel), anti-C/EBPβ (C-19, IP) and anti-G9a (immunoblot, middle panel), or anti-C/EBPβ (C-19, IP) and anti-C/EBPβ (H-7, immunoblot; lower panel), respectively. hELA2 transcript was determined by quantitative PCR (bar graph) with and without PMA stimulation of U937 cells, as indicated. B, Chromatin immunoprecipitation assay of the hELA2 promoter (–117/+1; –1959/–1707 served as control; lower panel) from unstimulated (black bars and upper panel) or PMA-stimulated (white bars and middle panel) U937 cells. Antibodies were used as indicated. Quantitative PCR results are expressed as fold enrichment over anti-tubulin. Quantitative PCR conditions were 40 cycles at 95 °C for 30 s, 57 °C for 10 s, and 72 °C for 20 s. PCR products were analyzed on 1.8% agarose gels for visualization. Error bars in A and B represent the S.D. from two independent experiments.

