
FIGURE 6.
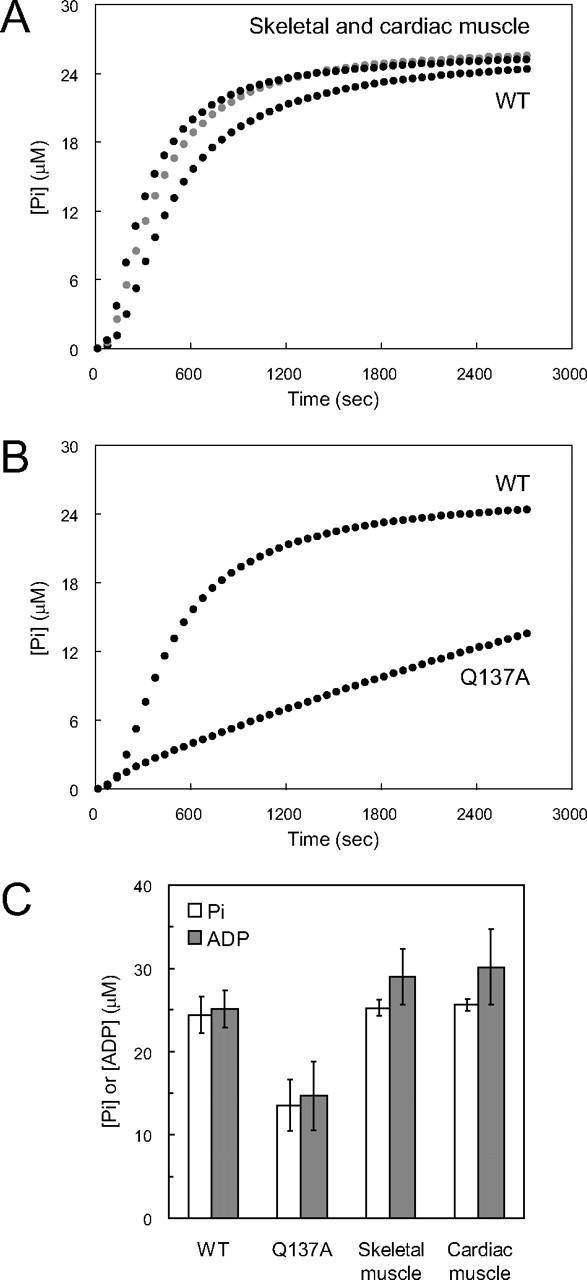
Actin ATPase rate during polymerization. A and B, time courses of Pi release from WT, Q137A, and tissue-purified actins (skeletal muscle, black; cardiac muscle, gray) during polymerization. The concentrations of Pi released from actin solutions at 25 μm were measured with an EnzChek phosphate assay kit. The solution conditions for polymerization were the same as those in the experiments described in Fig. 5. The indicated time courses were obtained by averaging three measurements for WT and tissue-purified actins and four measurements for Q137A. For each actin species, at least two independent preparations were used. C, concentrations of Pi released and total ADP at 45 min after initiation of polymerization. The actin concentration was 25 μm. The concentrations of Pi released correspond to those at the ends of the curves in A and B. The total ADP concentration was measured by reverse-phase HPLC and averaged over six measurements for WT and cardiac muscle actin, four for Q137A, and eight for skeletal muscle actin. For each actin species, at least two independent preparations were used. Bars indicate ± S.D.