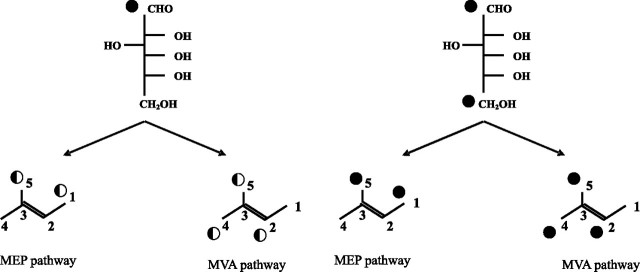
FIGURE 2.
MVA and MEP pathway-specific labeling pattern of isoprene units resulting from glucose catabolism via glycolysis (according to Ref, 27) shown separately for [1-13C]glucose and [1,6-13C2]glucose. Half-black circle indicates 13C abundance in isoprene units, which is 50% of the initial one in [1-13C]glucose (see “Results”). Numbering of carbon atoms is indicated.

