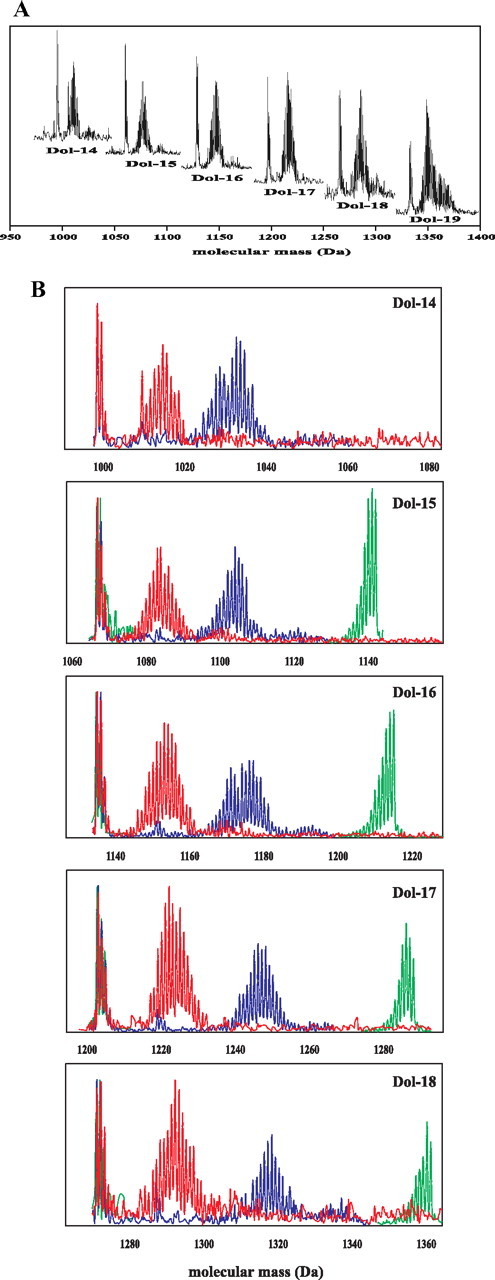
FIGURE 3.

Profiles of dolichol isotopomer signals obtained from in vivo labeling with glucose. A, overlaid HPLC/ESI-MS spectra of Dol-n (-14 up to -19) obtained from [1-13C]glucose. B, spectra acquired after all three feeding experiments: red, [1-13C]glucose; blue, [1,6-13C2]glucose, and green, [U-13C6]glucose. In all samples, the group of low mass signals represents residual population of native dolichols remaining from root inoculum.
