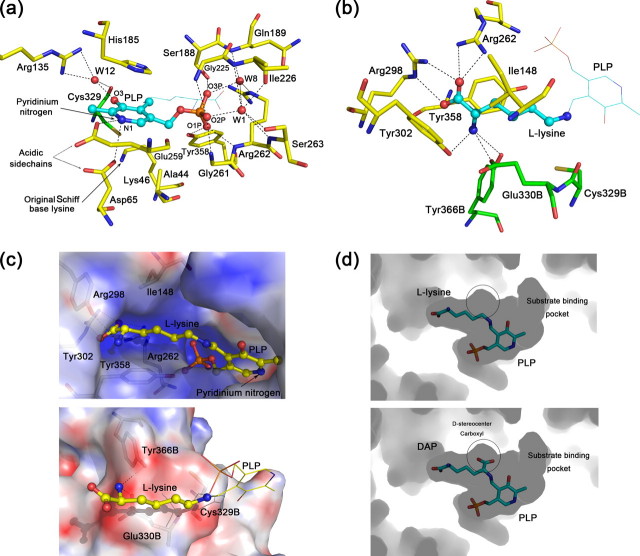
FIGURE 2.
Active site structure of HpDAPDC. a, PLP-binding site of HpDAPDC. Oxygen, nitrogen, phosphorus, and sulfur atoms are colored red, blue, orange, and dark yellow, respectively, and hydrogen bonds are presented as dotted lines (same below). The carbons of ligand and protein are colored cyan and yellow, respectively. b, substrate-binding site of HpDAPDC. The color scheme is the same as a except that the residues from another protomer (with letter “B” in their names) are colored green. c, electrostatic potential distribution on the active site inner walls, colored red to blue representing -20 e/kT to +20 e/kT. The potential is calculated by Adaptive Poisson-Boltzmann Solver (42). d, active pocket viewed by looking into the interior of HpDAPDC dimer. The substrate DAP is modeled into the pocket (lower panel) by being superposed onto the bound l-lysine (upper panel). The white circles denote the space to accommodate the d-stereocenter carboxyl of DAP.

