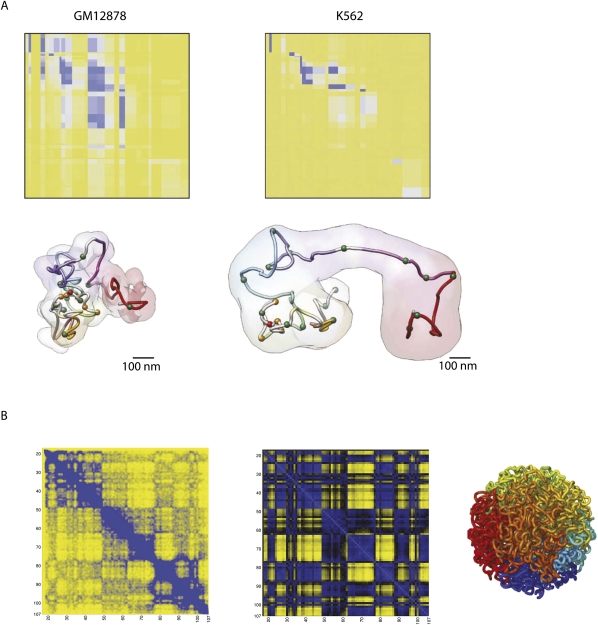
Figure 4.
5C and HiC offer matrices of interaction frequencies. (A) 5C results across 500 kb around the inactive and active α-globin locus (in GM12878 and K562 cells, respectively) (top) are modeled to show that the active locus adopts a more open conformation, whereas in the inactive state, the locus shows a closed conformation (bottom). Used with permission from Macmillan Publishers Ltd. (from Bau et al. 2011) (© 2011). (B) Based on HiC data, chromosome-wide matrices of interaction frequencies can be plotted. A contact map with 1-Mb resolution (with a step size of 100 kb) of human chromosome 14 is shown. The middle panel shows the plaid-like pattern, which is the ultimate result of the HiC analysis method. The right panel shows a fractal globule, a model for human chromosome organization that was postulated based on HiC data (Lieberman-Aiden et al. 2009) and theoretical analysis (Grosberg and et al. 1993). Plots are based on data from Gene Expression Omnibus entry GSE18199 (Lieberman-Aiden et al. 2009).

