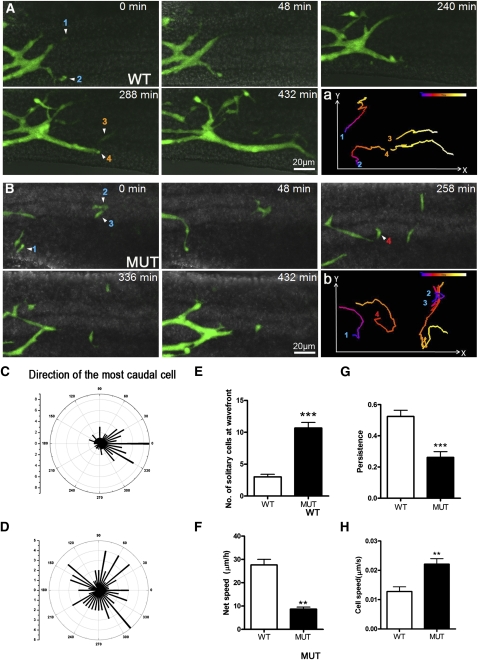
Figure 2.
Live imaging of ENCC migration along the gut. (A,B) Still images from time-lapse movies of the hindgut of E12.5 wild-type;RetTGM/+ (A) and Phactr4humdy/humdy;RetTGM/+ mutant (B) whole-mount gut showing the caudal progression of ENCCs. (A, panel a) Wild-type ENCCs migrated as streams of cells in interconnected chains with a strongly rostral-to-caudal trajectory (left to right, respectively). (B, panel b) In contrast, Phactr4humdy ENCCs were largely solitary at or close to the migratory wave front with a random trajectory. (A, panel a; B, panel b) Numbers indicate four different cells tracked over 8 h at 5-min intervals, and the migration track is color-coded to indicate the relative time point. (C,D) Polar histograms represent the trajectories of the most caudal cell at 15-min intervals in three explants of E12.5 hindgut. The trajectories were determined by drawing a straight line from the position of the most caudal cell with its position 15 min previously, with 0 degree being the rostrocaudal axis of the gut. The number shown on the inner arcs represent the frequency with which the cell was detected at that angle. (E,F) Quantification of the number of solitary cells at the migration wave front (E) and net speed at which the migratory wave front of ENCCs migrated caudally along the gut (F). The net speed was determined by measuring the distance between the location of the wave front at the beginning of the sequence and its location at the end of the sequence (a minimum of 8 h later). (G,H) Analysis of persistence (ratio of the direct length from start to end divided by the total track length) (G) and speed (H) of migrating ENCCs. Data are expressed as mean ± SD in three independent experiments. (***) P < 0.001; (**) P < 0.01; (*) P < 0.05, Student's t-test.

