Figure 2.
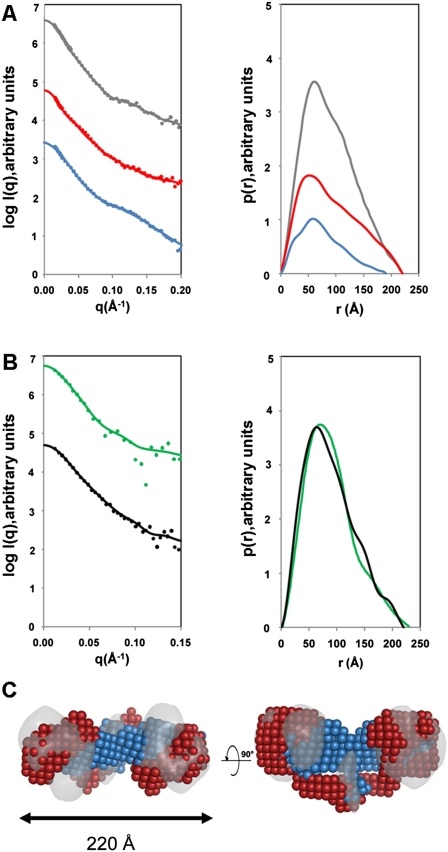
SANS and SAXS analyses. (A) SANS profiles of EcoR124I. The left panel shows the scattering data, and the right panel shows the pair distribution functions, p(r). (Gray) Protonated EcoR124I in 0% D2O; (blue) MTase core in situ within the RM enzyme (deuterated HsdR and protonated MTase measured in 100% D2O); (red) the two HsdR in situ in the RM enzyme (deuterated HsdR and protonated MTase measured in 40% D2O). (B) SAXS profiles of EcoR124I (black) and EcoKI (green). The panel on the left shows the scattering data, and the right panel shows the pair distribution functions, p(r). In both A and B, the solid lines in the scattering data represent the fits from the corresponding back-transformed distance distribution functions, p(r), in the panel on the right. (C) Multiphase ab initio modeling showing the location of the MTase core (blue) and the HsdR (red), superimposed on the EM map of EcoR124I from Figure 1B (gray). The panel on the right shows a 90° rotation about the long axis in the left panel. Data on the assembly of the EcoR124I enzyme can be found in Supplemental Figure S3.

