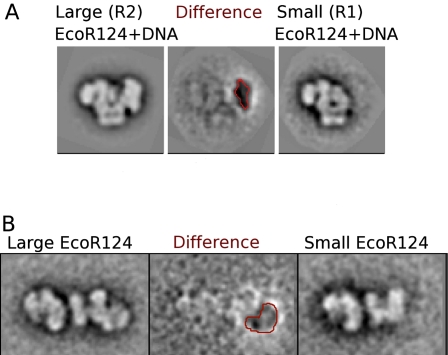
Figure 3.
2D difference images from EM data show the position of the HsdR in the EcoR124I complex. (A) Difference imaging between image averages of large (left) and small (right) particles in the EcoR124I+DNA negative stain EM data set reveals a large “negative density” region (red contour at −2.5 σ), consistent with a missing HsdR in the small particles. (B) Difference imaging of HsdR in the open state of EcoR124I (without DNA). Although the relative flexibility of the open complex gives rise to a less well-defined difference map, a region of negative density consistent with a missing HsdR is visible nevertheless (red contour).

