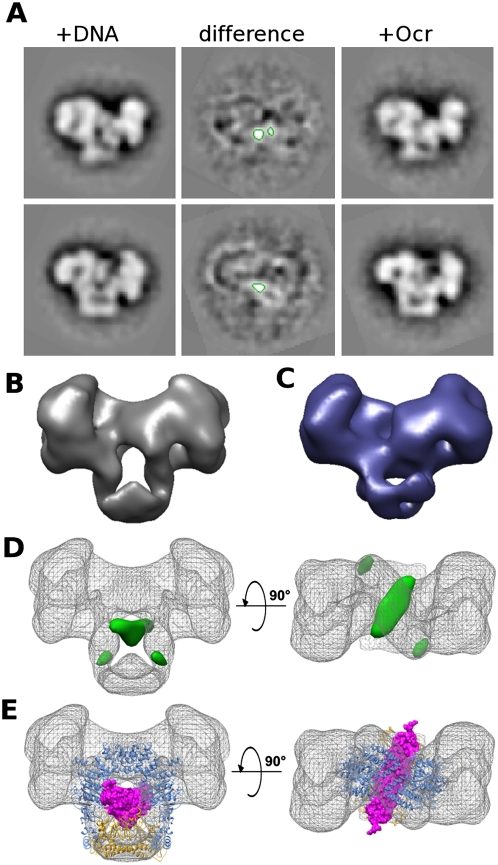
Figure 4.
2D and 3D difference mapping from EM data shows the route of DNA/Ocr through the EcoR124I complex. (A) Negative stain EM difference image averages of EcoR124I+DNA and EcoR124I+Ocr from two orientations show a smaller central area of positive difference (green contours at +4.5 σ), indicating the position of the DNA mimic Ocr, which excludes stain more effectively than DNA. (B) Surface view of the 3D reconstruction of EcoR124I+DNA. (C) Surface view of the 3D reconstruction of EcoR124I+Ocr shows the central hole is mostly occluded in the Ocr-containing complex when compared with the EcoR124I+DNA surface shown in B. (D) Two views of the DNA/Ocr 3D difference map (green surface, contoured at +4.5 σ) overlaid onto the EcoR124I+DNA map (gray mesh) showing the main positive difference densities. (E) Two views of the EcoR124I+DNA 3D map (gray mesh) with the EcoKI MTase core+Ocr atomic model (PDB code: 2y7C) docked in as a single rigid body. (Magenta spacefill) Ocr; (yellow ribbon) HsdS; (blue ribbon) 2× HsdM. The path of Ocr, as predicted from the MTase structure, matches well to the difference density.

