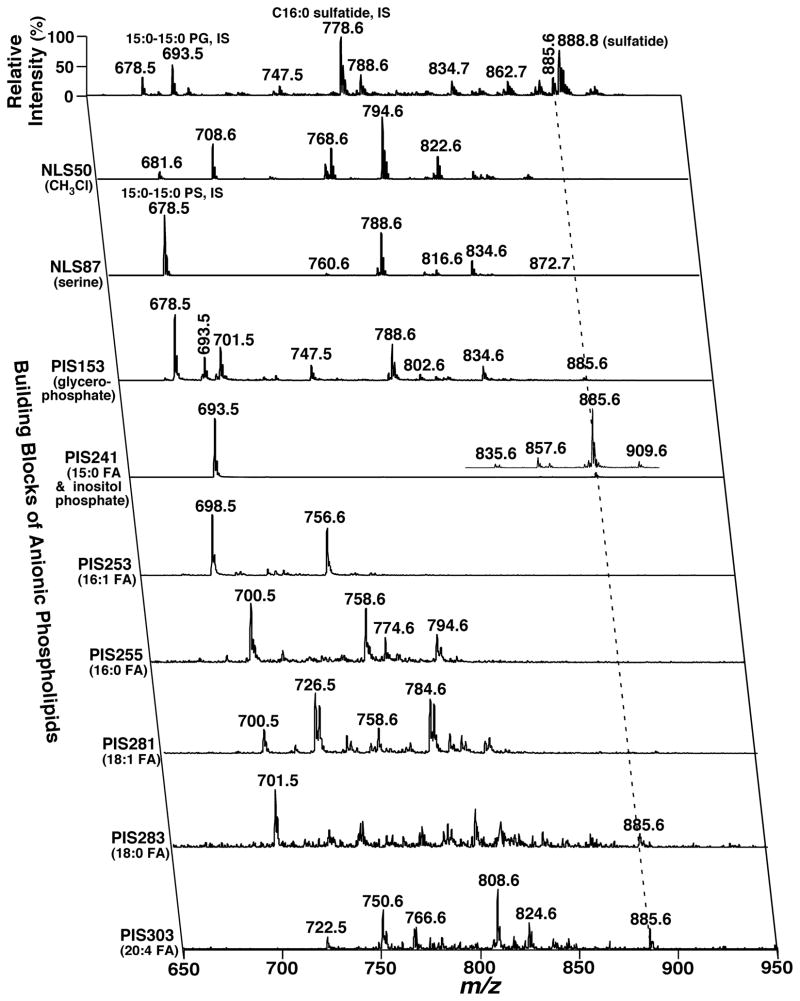
FIGURE 19.
Representative two-dimensional mass spectrometric analyses of anionic phospholipids in a lipid extract of mouse cortex. The lipid extract was prepared with a modified Bligh and Dyer procedure and properly diluted prior to direct infusion into an ESI QqQ mass spectrometer (TSQ quantum ultra mass spectrometer, Thermo Fisher Scientific, San Jose, CA). The survey scan or MS/MS scans of the 2D ESI mass spectrum were acquired in the negative-ion mode with sequentially programmed customized scans with Xcalibur software. “PIS” denotes precursor-ion scanning, “NLS” stands for neutral-loss scan, and “IS” represents internal standard. All scans are displayed after normalization to the base peak in each individual scan.

