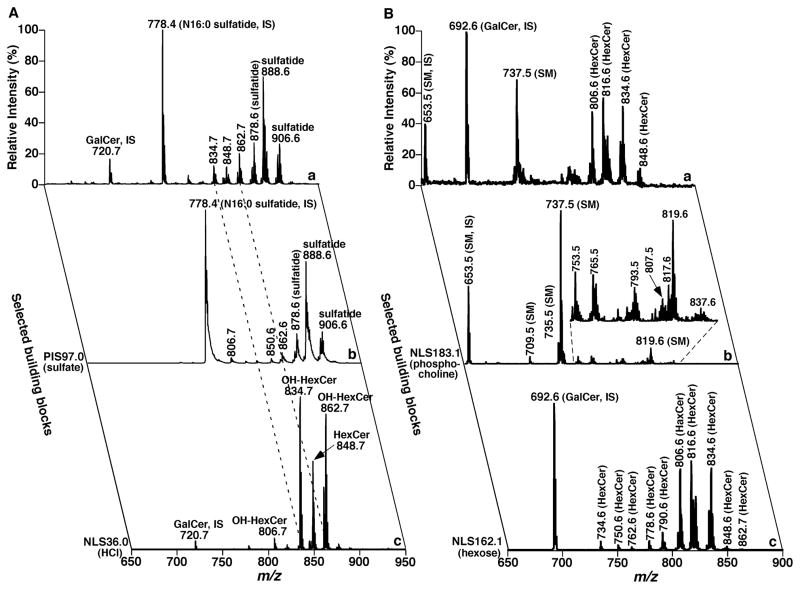
FIGURE 21.
Two-dimensional mass spectrometric analyses of sphingolipid species after treatment of a mouse cortex lipid extract with lithium methoxide. Panel A shows the analyses of sphingolipids in the lipid extract of mouse cortex after treatment with lithium methoxide in the negative-ion mode. Building block analyses of the lipid extract after treatment with lithium methoxide were acquired with precursor-ion scanning (PIS) of m/z 97 (i.e., sulfate) for the analysis of sulfatide species and neutral-loss scanning (NLS) of 36 u (the loss of HCl from cerebroside (HexCer) chloride adducts) identifies the presence of 2-hydroxy HexCer, respectively. Panel B shows the analyses of sphingolipids in the lipid extract of mouse cortex after treatment with lithium methoxide in the positive-ion mode after addition of a small amount of LiOH. The mass trace “a” in Panel B is the survey scan of the lipid extract of mouse cortex after treatment with lithium methoxide. The mass trace “b” in Panel B identifies the presence of sphingomyelin (SM) species in the solution with NLS183.1, which corresponds to phosphocholine. The mass trace “c” in Panel B identifies the presence of HexCer species in the solution with NLS162.1, which corresponds to hexose. Analyses of this mass spectrum and the mass trace “c” in Panel A identify the individual HexCer species with or without a hydroxy moiety. IS denotes internal standard. Each spectrum displayed is normalized the base peak in the spectrum.

